Is Ethereum Price Set for a Rebound as a Prominent Whale Accumulates $119M After the Dip?


Highlights
- Whale accumulation intensified as $85M USDT funded large ETH withdrawals during the market dip.
- Weekly ETF inflows reached $209.1M, with BlackRock driving institutional ETH exposure.
- Ethereum maintains structural support, keeping rebound conditions technically intact.
The Ethereum price remains a subject of attention as the market downturn redefines short-term market positions in both spot and derivative markets. ETH price responded to renewed whale buying and institutional buying in general despite the overall weakness.
Besides, leveraged buying and ETF demand emerged during price declines, reinforcing underlying demand conditions. The state of affairs continues to make ETH price action, institutional involvement, and technical composition the focus of short-term direction.
Whale Accumulation And ETF Inflows Back Ethereum Price.
As reported by Lookonchain, a large whale resumed Ethereum accumulation at the time of market dip. The speech borrowed $85 million USDT on Aave and sent the money to Binance. Soon after, it sold 38,576 ETH valued at about 119.3 million.
This move came after previous accruals of 489,696 ETH worth close to 1.5 billion. This kind of positioning is an indication of calculated exposure in times of weakness and not defensive selling, which strengthens the presence of demand around the important ETH price levels.
Meanwhile, the institutional demand reinforced the price dynamics of Ethereum. Weekly ETF inflows of ETH were 209.1 million. BlackRock alone bought 138.7 million worth of ETH. These inflows were in the face of market softness, which underscored institutional allocation.
ETF absorption contributed to the counteraction of the selling pressure in the dip. Combined, whale leverage and ETF inflows indicate structured accumulation and not risk reduction.
$ETH ETF inflow of $209,100,000 🟢 last week.
BlackRock bought $138,700,000 in Ethereum. pic.twitter.com/MwzenojTjp
— Ted (@TedPillows) December 15, 2025
Analyst Defines Ethereum Price Direction With Key Levels
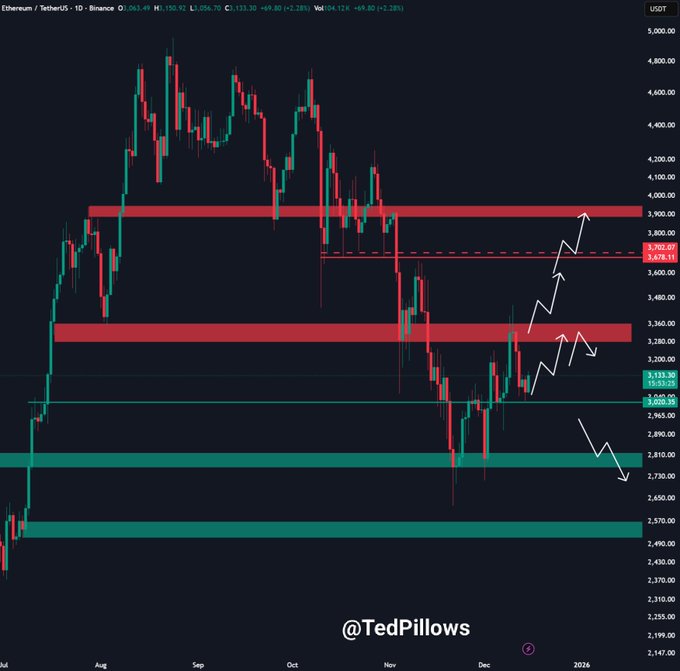
Analyst Ted focuses his analysis on the clearly defined Ethereum price levels instead of the projections of the speculative patterns. He observed that ETH price is still above the 3,000 mark even though it is volatile on the day.
Price fell to a low of less than $3,050, but it soon recovered, which supports the underlying demand. At the time of analysis, the valuation of ETH trades around $3,156, positioning price above critical support.
According to the expert, as long as the $3,000 support zone holds, Ethereum price could rally toward the $3,300-$3,400 range again. Nevertheless, he defined downside risk clearly as well.
A clear break of the $3,000 mark would probably cause a rapid fall to below the levels of sub-2,800. This model establishes the direction of ETH prices by confirming support as opposed to hypothetical upside.
ETH Price Structure Signals Support And Rebound Potential
Ethereum price is still evolving in a cup-and-handle pattern that emerged following the mid-November fall. The rounded base reflects a gradual shift from selling pressure toward steady demand, rather than a sharp rebound.
That stage enabled ETH price to recuperate in a systematic manner before getting into a handle stage. In this pullback, the price reversed in a controlled fashion and returned to the area of the $3,000. Buyers repelled that area decisively, and it was proved to be a structural support area and not a temporary reaction.
The region of 3,400 and above is a clear supply area. Ether price probed this region and returned, which signifies a focus on profit-taking and sell interest. Nonetheless, that rejection did not interfere with the larger price set-up. ETH price is currently in a range between the support at $3,000 and the range of 3,250 which indicates consolidation and not weakness.
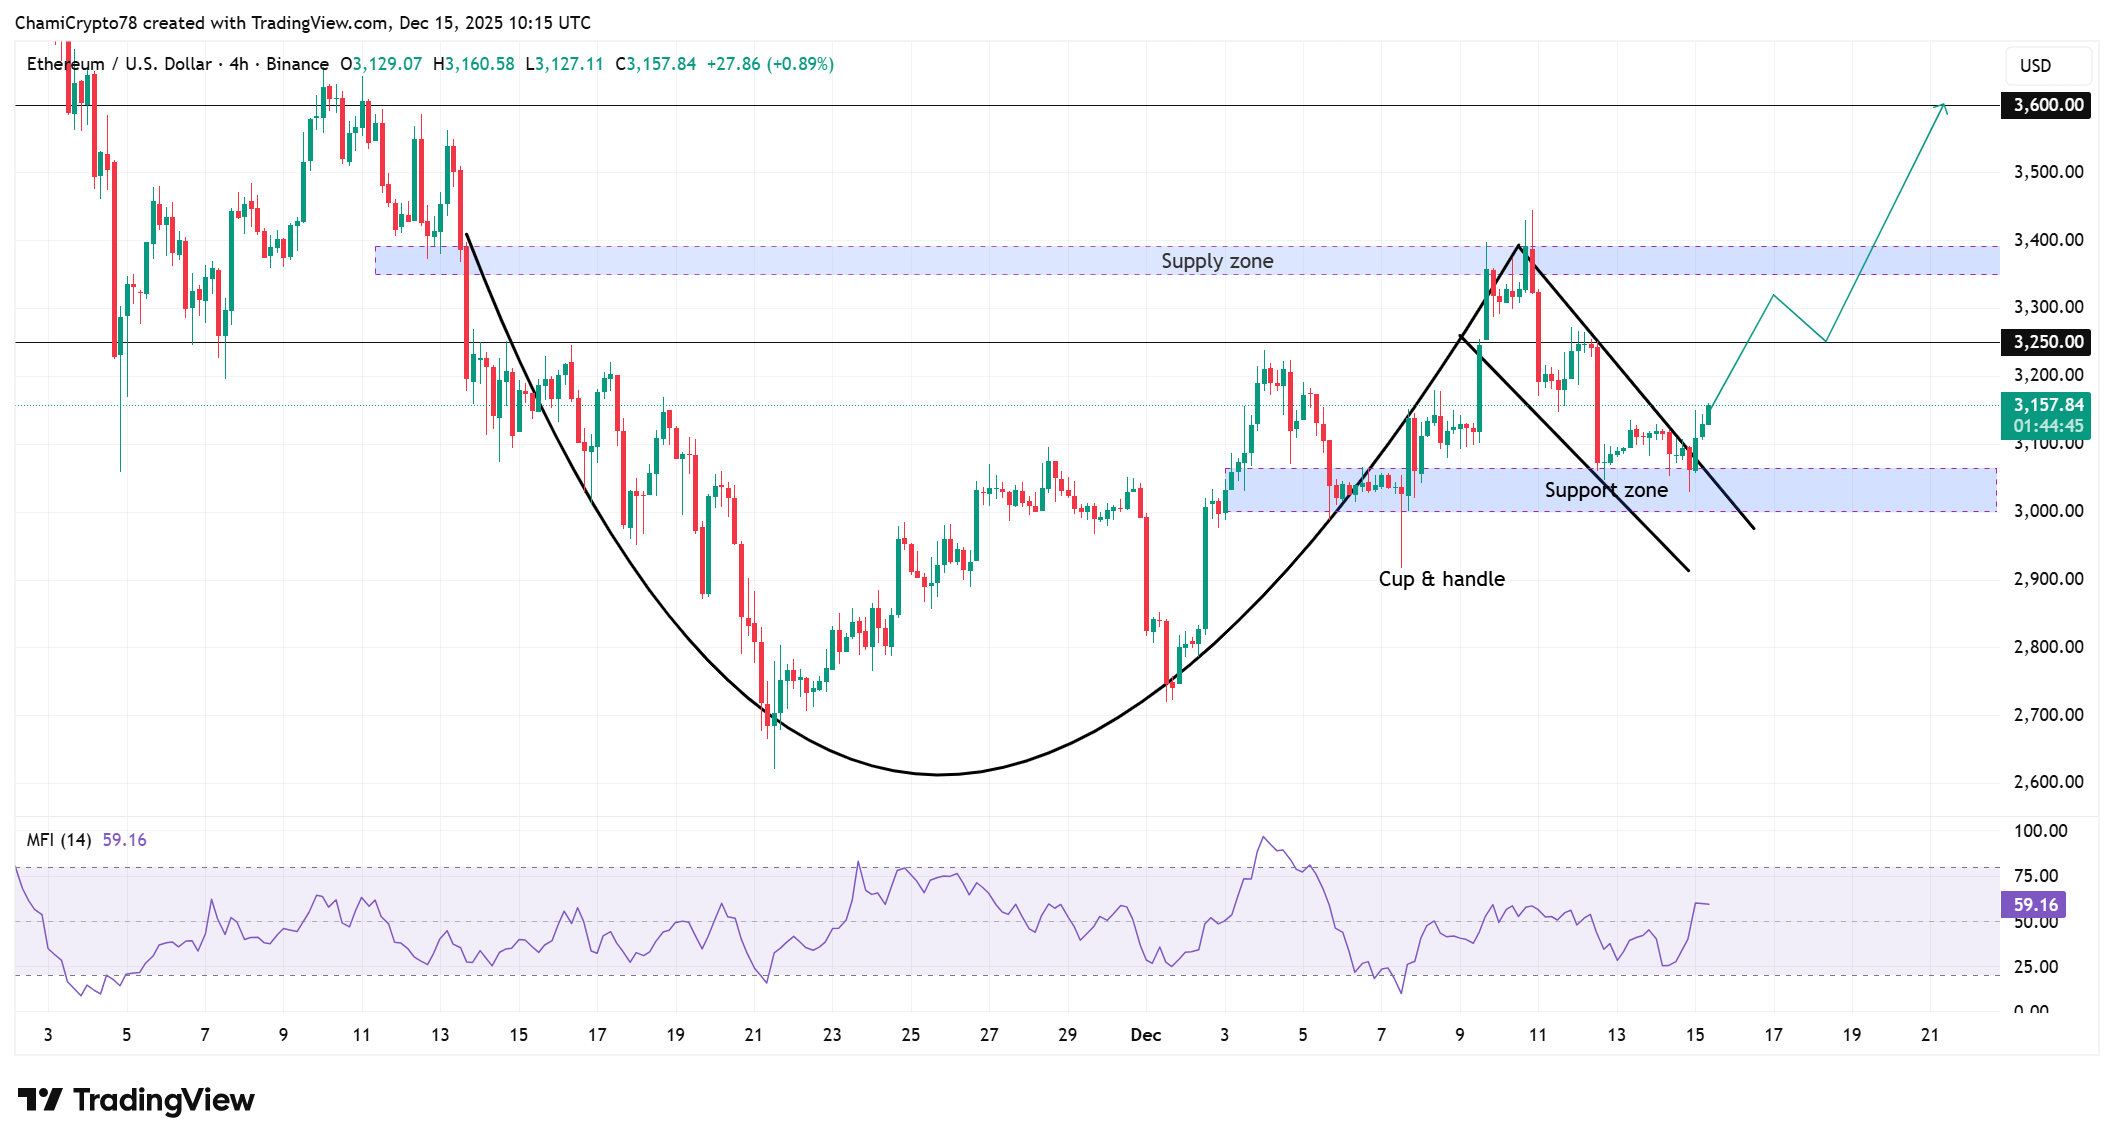
From an indicator perspective, the Money Flow Index (MFI) assists in the evaluation of the direction of capital flow. With the MFI at approximately 59, there is no stretched condition, and the buying pressure dominates over the selling pressure. This balance favors continuation potential as opposed to exhaustion.
The structure is biased towards upside continuation as long as ETH price remains above the level of 3,000 and recovers 3,250. Ultimately, this setup frames future Ethereum price performance around supply absorption and support resilience.
Summary
Ethereum price currently reflects recovery support rather than a temporary stabilization The presence of whales in the market downturn and high inflows of ETFs strengthen the background demand.
ETH price holding above the $3,000 support zone preserves the rebound setup rather than invalidating it. As long as that level holds, Ethereum price carries a clear possibility of a rebound toward the $3,300-$3,400 zone.
Frequently Asked Questions (FAQs)
1. What does whale accumulation during a dip indicate?
2. Why are ETF inflows important for Ethereum?
3. What role does the $3,000 zone play structurally?

Why Trust CoinGape
CoinGape has covered the cryptocurrency industry since 2017, aiming to provide informative insights Read more…to our readers. Our journal analysts bring years of experience in market analysis and blockchain technology to ensure factual accuracy and balanced reporting. By following our Editorial Policy, our writers verify every source, fact-check each story, rely on reputable sources, and attribute quotes and media correctly. We also follow a rigorous Review Methodology when evaluating exchanges and tools. From emerging blockchain projects and coin launches to industry events and technical developments, we cover all facets of the digital asset space with unwavering commitment to timely, relevant information.
Premium Partners


Related Articles


- First Hyperliquid ETF Launch ‘Imminent’ as Bitwise Files Amended S-1 With SEC
- XRP News: Ripple’s RLUSD Eyes Wider Adoption as Stablecoin Expands to Coinbase’s L2 Base
- Breaking: Michael Saylor’s Strategy Buys 10,645 Bitcoin as Crypto Market Braces for Japan Rate Hike
- Breaking: Institutional Tokenization on Ethereum Expands as JPMorgan Launches Onchain Fund
- World’s Highest IQ Holder Projects $100 XRP in 5 Years, What Does He Know?
- Is Ethereum Price Set for a Rebound as a Prominent Whale Accumulates $119M After the Dip?
- XRP Spot ETF Records Nearly $1B Inflows While BTC and ETH Bleed- Is A XRP Price Reversal Ahead?
- Bitwise SOL ETF Records 33 Days of Nonstop Inflows- Is A Recovery to $150 Possible?
- Will Bittensor Price Break Above $400 After First TAO Halving Tomorrow?
- Expert Predicts Bitcoin Price Crash to $75k as ETF Inflows Fall, Treasury Companies Plunge 83%
- HYPE Price Jumps 8% as Open Interest Hits $1.61B — Is $50 Next?


