Is LUNC Price Ready to Reverse? Falling Channel Pattern Hints at 20% Recovery
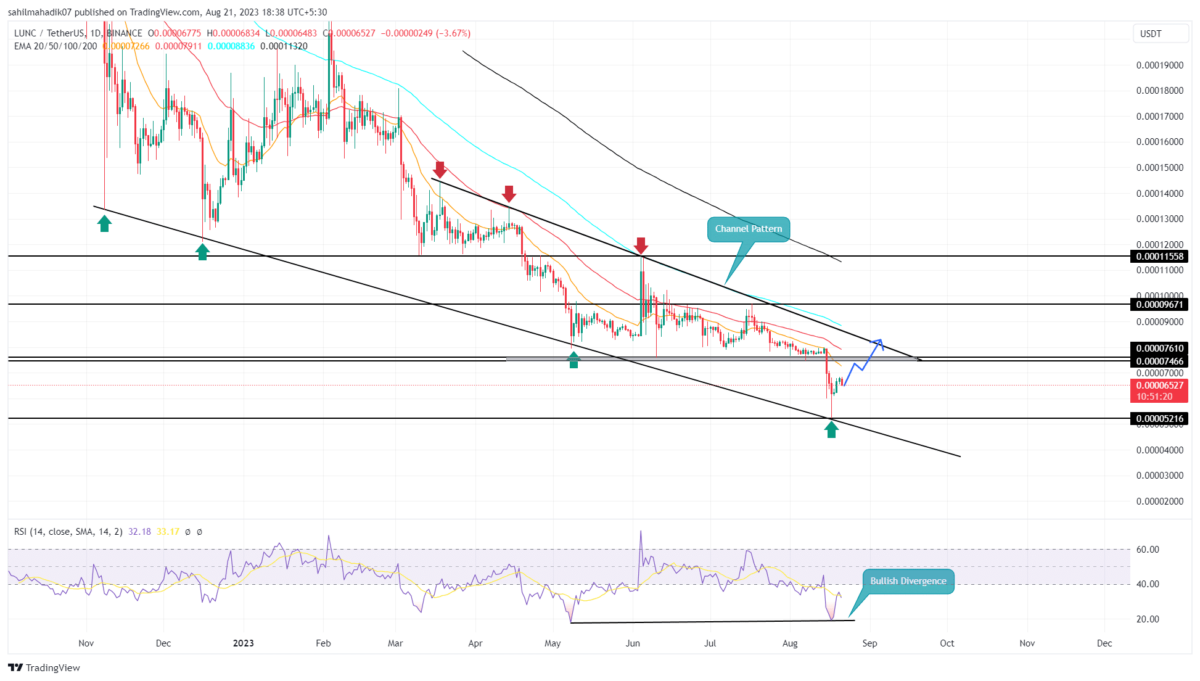
Taking a close look at the daily time frame chart, it’s evident that the LUNC price traveled a steady downtrend within a falling channel pattern for the past five months. This pattern is marked by parallel trendlines encompassing the price action, serving as key support and resistance areas. Amid the recent correction in the crypto market, the coin price found itself at the bottom of the channel pattern. This occurrence can often spark hope for a potential trend reversal, as historical support levels may attract buying interest.
Also Read: Terra Luna Classic Proposal To Directly Burn 800 Mln USTC Officially Passed, LUNC Jumps
Terra Classic Daily Chart: Key Points
- A falling channel pattern influences the current downturn in LUNC price
- A bullish reversal from the support trendline hints at renewed interest in the asset and triggered discussions about the possibility of a trend reversal
- The intraday trading volume in the LUNC coin is $19.6 Million, indicating a 19% loss.
In mid-July, the Terra classic coin initiated a new correction trend leading to a substantial 44% decline in the coin’s market value. During this period, the price plummeted from a high of $0.000009689 to $0.000005234 low. Notably, the decline brought the price to the lower boundary of the falling channel, instilling a sense of hope for a potential reversal.
In the last five days, the LUNC price has experienced a bounce back of 22% where it currently exchanges hands at $0.00006582.
In an ideal bullish scenario, the recent surge could be the initial phase of a larger trend reversal. If the momentum continues and strengthens, it could propel the coin’s price back toward the overhead trendline. Achieving this would signify a potential gain of around 20% from the current levels.
Channel Pattern Hints Opportunity for Trend Reversal
A key principle from the Dow theory of the financial market indicates no trend remains the same. Therefore, the interested market participants must remain patient until the Terra classic coin provides a bullish breakout from the overhead trendline. This breakout will trigger a change in market sentiment and could bolster buyers to reclaim higher ground such as $0.0000967, followed by $0.000115, and $0.000145.
- Exponential Moving Average: The 20-and-100-day EMA acts as a dynamic resistance against coin buyers.
- Relative Strength Index: In contrast to an evident downfall in price action, the strength indicator RSI projects the same lows indicating the rising bullish momentum at a lower price
Recent Posts
- Price Analysis
Will Solana Price Hit $150 as Mangocueticals Partners With Cube Group on $100M SOL Treasury?
Solana price remains a focal point as it responds to both institutional alignment and shifting…
- Price Analysis
SUI Price Forecast After Bitwise Filed for SUI ETF With U.S. SEC – Is $3 Next?
SUI price remains positioned at a critical intersection of regulatory positioning and technical structure. Recent…
- Price Analysis
Bitcoin Price Alarming Pattern Points to a Dip to $80k as $2.7b Options Expires Today
Bitcoin price rebounded by 3% today, Dec. 19, reaching a high of $87,960. This rise…
- Price Analysis
Dogecoin Price Prediction Points to $0.20 Rebound as Coinbase Launches Regulated DOGE Futures
Dogecoin price has gone back to the spotlight as it responds to the growing derivatives…
- Price Analysis
Pi Coin Price Prediction as Expert Warns Bitcoin May Hit $70k After BoJ Rate Hike
Pi Coin price rose by 1.05% today, Dec. 18, mirroring the performance of Bitcoin and…
- Price Analysis
Cardano Price Outlook: Will the NIGHT Token Demand Surge Trigger a Rebound?
Cardano price has entered a decisive phase as NIGHT token liquidity rotation intersects with structural…