Is Polygon Coin A Good Investment Amid Uncertainty?


The last three months of price action in polygon coin shows the formation of a rounding bottom pattern. This bullish reversal pattern is characterized by a gradual U-shaped curve in which the price of an asset decreases over a period of time before gradually increasing again. However, With the ongoing uncertainty in the crypto market, MATIC is poised for a minor correction and offers a discounted opportunity to trade. Here are the levels that coin holders should watch
Key Points
- In theory, the rounding bottom pattern indicates a transition from a downtrend to an uptrend and is often considered a sign that a bottom has been reached.
- The ongoing correction in MATIC price could stabilize the bullish trend for further rally.
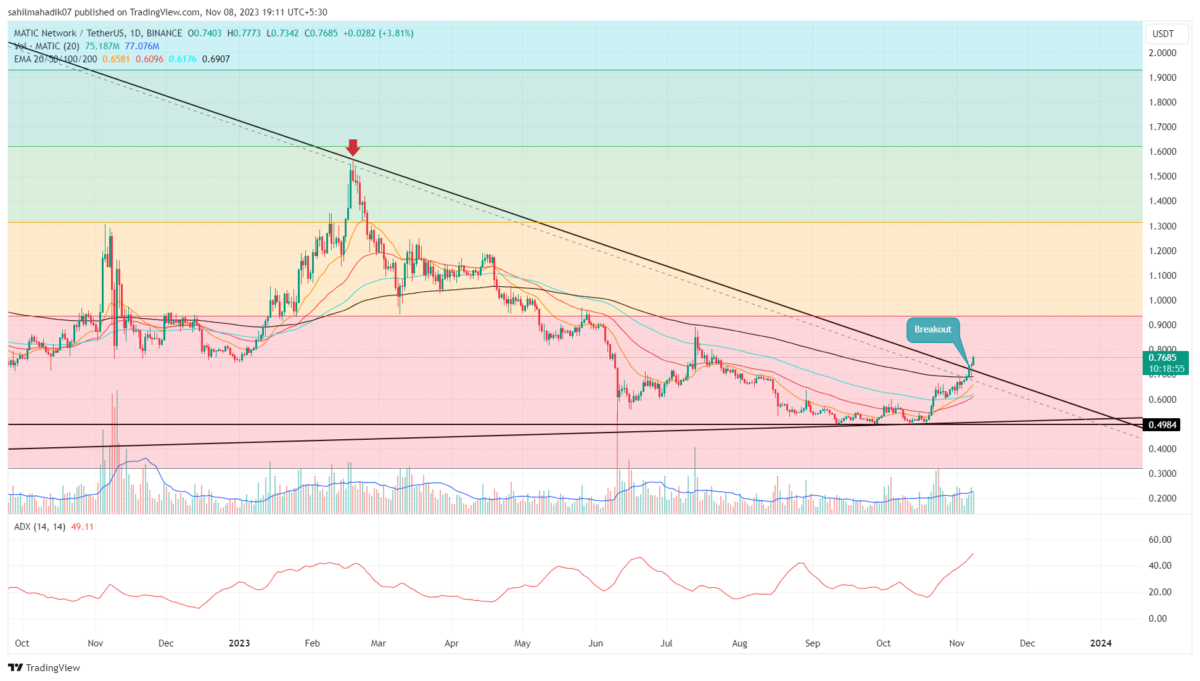
- The intraday trading volume in the MATIC is $411.2 Million, indicating a 14.3% loss.
 Source- –Tradingview
Amid the new year recovery, the Polygon coin price rallied 58.8% since January 1st and formed a local top at $1.193. However, concerned with today’s FOMC meeting, the market sentiment showed indecisiveness over the last two weeks and stalled bullish growth in a majority of cryptocurrencies.
As a result, the Polygon coin price reverted from the $1.193 resistance and tumbled 7.5% to reach the current price of $1.09. Moreover, if the selling pressure persists, the altcoin may dive another 5.5% to retest this $1.03 support.
Also Read: CRYPTO TELEGRAM CHANNELS LIST 2023
However, the reducing volume during this pullback indicates this correction is temporary, and prices are likely to resume a bullish recovery. Thus, under the influence of the rounding bottom pattern, the coin price should challenge the $1.3 barrier in the near future.
Anyhow, in an ideal bullish condition, this technical setup shall push the MATIC price to the $1.835 mark.
Technical Indicators
RSI: The Relative Strength Index indicator is a momentum oscillator that measures the strength of a coin’s price action by comparing the magnitude of recent gains to recent losses. Thus, a rising MATIC price and falling RSI hint at the weakness in bullish momentum and a higher possibility for the correction phase.
EMAs: the rising EMAs(20, 50, 100, and 200), wavering near the $1.03 and $0.935 mark, creates a strong support zone for coin holders.
Polygon Coin Price Intraday Levels
- Spot rate: $1.09
- Trend: Bearish
- Volatility: Medium
- Resistance levels- $1.19 and $1.3
- Support levels- $1.035 and $0.935

Why Trust CoinGape
CoinGape has covered the cryptocurrency industry since 2017, aiming to provide informative insights Read more…to our readers. Our journal analysts bring years of experience in market analysis and blockchain technology to ensure factual accuracy and balanced reporting. By following our Editorial Policy, our writers verify every source, fact-check each story, rely on reputable sources, and attribute quotes and media correctly. We also follow a rigorous Review Methodology when evaluating exchanges and tools. From emerging blockchain projects and coin launches to industry events and technical developments, we cover all facets of the digital asset space with unwavering commitment to timely, relevant information.
Related Articles


- Why Is Pi Coin Price Rising Today? Key Reasons Explained
- BestChange Wins Best Crypto Exchange Rate Aggregator at the Crypto Impact Awards 2025
- Arthur Hayes Blames BlackRock’s IBIT Hedging for Bitcoin Crash as BTC Price Rebounds 7%
- When Will the Crypto Winter Finally End?
- Crypto Market Bill Nears Key Phase as White House Sets Feb 10 Meeting to Reach Deal
- Bitcoin and XRP Price Outlook Ahead of Crypto Market Bill Nearing Key Phase on Feb 10th
- Bitcoin Price Prediction as Funding Rate Tumbles Ahead of $2.1B Options Expiry
- Ethereum Price Outlook as Vitalik Buterin Sells $14 Million Worth of ETH: What’s Next for Ether?
- Solana Price at Risk of Crashing Below $50 as Crypto Fear and Greed Index Plunges to 5
- Pi Network Price Prediction Ahead of PI KYC Validator Reward System Launch
- XRP Price Outlook As Peter Brandt Predicts BTC Price Might Crash to $42k


