
Is SHIB Price Heading to $0.000005? 50 Days Chart Pattern Gives a Hint


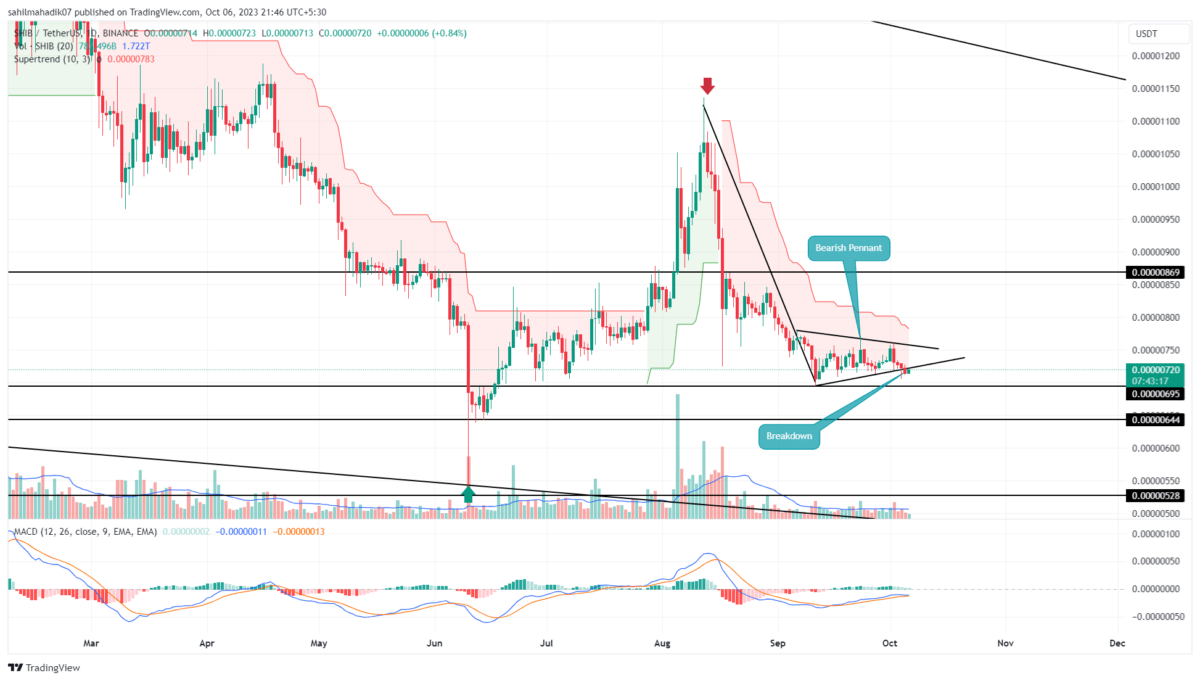
After witnessing a substantial decline from mid-August to September, followed by a period of sideways movement, the Shiba Inu coin outlined an inverted pennant pattern on its daily chart. Recognized as a bearish continuation pattern, this formation typically allows sellers to regain control, ushering in an extended correction phase. A recent breach from the pattern’s support hints at a further descent below $0.000007.
Also Read: Shiba Inu Admin Profile Hack, All You Should Know
Pennant Pattern Sets a 10% drop
- Completion of the inverted pennant pattern should accelerate the supply pressure.
- The $0.000007 and $0.00000644 are strong supports.
- The intraday trading volume of the Shiba Inu coin is $64.5 Million, showing a 2.5% gain.
 Source- Tradingview
On October 5th, the Shiba Inu price confirmed a bearish breakout beneath the pennant pattern’s support trendline. Conventionally, this movement would signify an impending bearish run, reinforcing sellers’ dominance in the market.
Yet, the breakout candle’s modest trading volume, coupled with a lack of substantial follow-through, points to potential fragility in the bearish momentum. Thus, investors contemplating shorting might want to await a suitable follow-up before entering.
If this memecoin shows sustainability below the breached support, it’s plausible that the price could tumble, aiming for a 10% decrease to reach $0.000001065, and potentially even dropping to $0.00000105.
Despite this seemingly grim outlook, a broader perspective reveals that this correction is nested within a larger falling wedge pattern. Here, the price is confined between two converging trendlines, resulting in a gradually narrowing downward drift.
For those with a bullish stance on this dog-themed meme coin, it’s advisable to await a decisive breakout above the wedge’s resistance trendline as confirmation of a trend shift.
SHIB vs DOGE Performance
 Source: Coingape| Dogecoin Vs Shiba Inu Price
A retrospective analysis over the past half-year for both Dogecoin and Shiba Inu indicates a consistent bearish trajectory. However, Dogecoin price appears to be at a pivotal juncture, hovering precariously near its prior swing low support of $0.24. While this robust support level has the potential to catalyze a notable Doge rally, adverse broader market sentiments might push it beneath this threshold, paving the way for a significant pullback.
- Super Trend: The red film projected in the daily chart reflects a bearish trend in play.
- Moving Average Convergence Divergence: A bullish alignment between the MACD(blue) and signal(orange) accentuates the weakness in bearish momentum.

Why Trust CoinGape
CoinGape has covered the cryptocurrency industry since 2017, aiming to provide informative insights Read more…to our readers. Our journal analysts bring years of experience in market analysis and blockchain technology to ensure factual accuracy and balanced reporting. By following our Editorial Policy, our writers verify every source, fact-check each story, rely on reputable sources, and attribute quotes and media correctly. We also follow a rigorous Review Methodology when evaluating exchanges and tools. From emerging blockchain projects and coin launches to industry events and technical developments, we cover all facets of the digital asset space with unwavering commitment to timely, relevant information.
24 Hours volume
$85.68M
Market Cap
$3.5B
Max Supply
1000T


