Is SHIB Price Heading to $0.000005? 50 Days Chart Pattern Gives a Hint
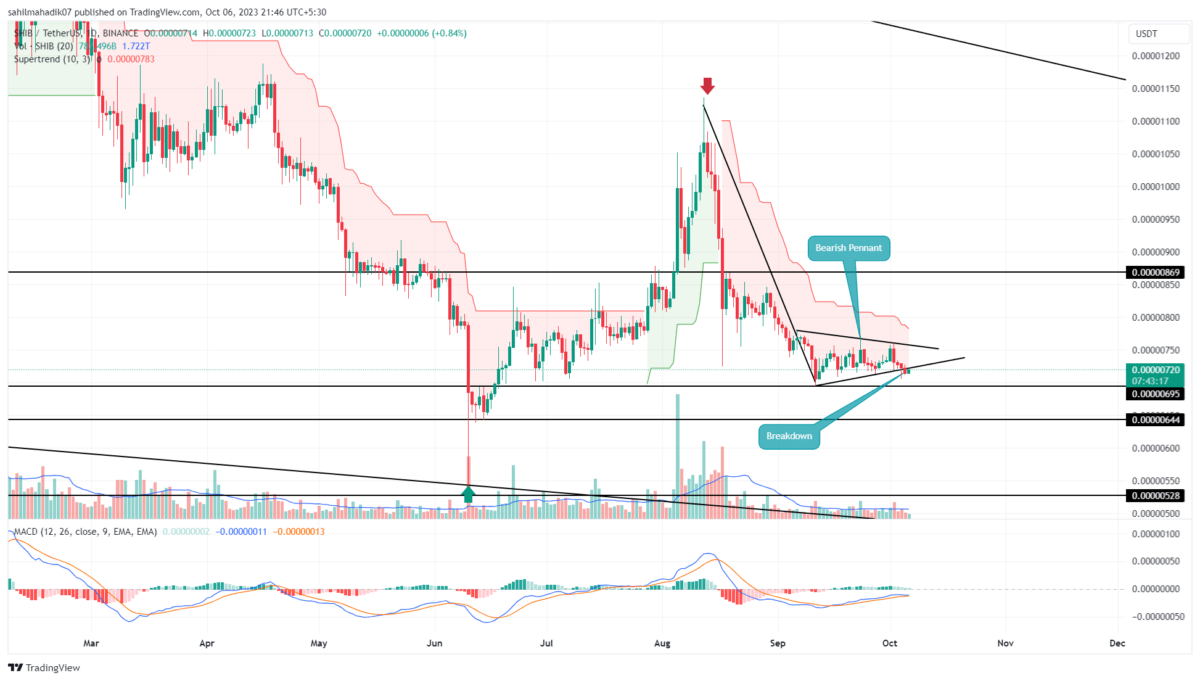
After witnessing a substantial decline from mid-August to September, followed by a period of sideways movement, the Shiba Inu coin outlined an inverted pennant pattern on its daily chart. Recognized as a bearish continuation pattern, this formation typically allows sellers to regain control, ushering in an extended correction phase. A recent breach from the pattern’s support hints at a further descent below $0.000007.
Also Read: Shiba Inu Admin Profile Hack, All You Should Know
Pennant Pattern Sets a 10% drop
- Completion of the inverted pennant pattern should accelerate the supply pressure.
- The $0.000007 and $0.00000644 are strong supports.
- The intraday trading volume of the Shiba Inu coin is $64.5 Million, showing a 2.5% gain.
On October 5th, the Shiba Inu price confirmed a bearish breakout beneath the pennant pattern’s support trendline. Conventionally, this movement would signify an impending bearish run, reinforcing sellers’ dominance in the market.
Yet, the breakout candle’s modest trading volume, coupled with a lack of substantial follow-through, points to potential fragility in the bearish momentum. Thus, investors contemplating shorting might want to await a suitable follow-up before entering.
If this memecoin shows sustainability below the breached support, it’s plausible that the price could tumble, aiming for a 10% decrease to reach $0.000001065, and potentially even dropping to $0.00000105.
Despite this seemingly grim outlook, a broader perspective reveals that this correction is nested within a larger falling wedge pattern. Here, the price is confined between two converging trendlines, resulting in a gradually narrowing downward drift.
For those with a bullish stance on this dog-themed meme coin, it’s advisable to await a decisive breakout above the wedge’s resistance trendline as confirmation of a trend shift.
SHIB vs DOGE Performance
A retrospective analysis over the past half-year for both Dogecoin and Shiba Inu indicates a consistent bearish trajectory. However, Dogecoin price appears to be at a pivotal juncture, hovering precariously near its prior swing low support of $0.24. While this robust support level has the potential to catalyze a notable Doge rally, adverse broader market sentiments might push it beneath this threshold, paving the way for a significant pullback.
- Super Trend: The red film projected in the daily chart reflects a bearish trend in play.
- Moving Average Convergence Divergence: A bullish alignment between the MACD(blue) and signal(orange) accentuates the weakness in bearish momentum.
Recent Posts
- Price Analysis
Pi Network Price Holds $0.20 After 8.7M PI Unlock, 19M KYC Milestone-What’s Next?
Pi Network price continues to trade just above the crucial $0.20 support, despite ongoing weakness…
- Price Analysis
XRP Price Prediction Ahead of US Strategic Crypto Reserve
As the year comes to an end, XRP price hovers near the $1.80 support level,…
- Price Analysis
Ethereum Price Prediction Ahead of the 2026 Glamsterdam Scaling Upgrade – Is $5,000 Back in Play?
Ethereum price is in a critical stage as ETH price is in line with the…
- Price Analysis
Cardano Price Eyes a 40% Surge as Key DeFi Metrics Soar After Midnight Token Launch
Cardano price remains in a deep bear market, continuing a sell-off that started in December…
- Price Analysis
FUNToken Price Surges After MEXC Lists $FUN/USDC Pair
FUNToken, one of the most talked-about low-cap cryptos on the market with P2E undertones, has…
- Price Analysis
Bitcoin Price on Edge as $24B Options Expire on Boxing Day — Is $80K About to Crack?
Bitcoin enters the final stretch of the year with the price behavior signaling a decisive…