Is Terra Classic (LUNC) Price In Danger Of Collapsing To $0.0001?
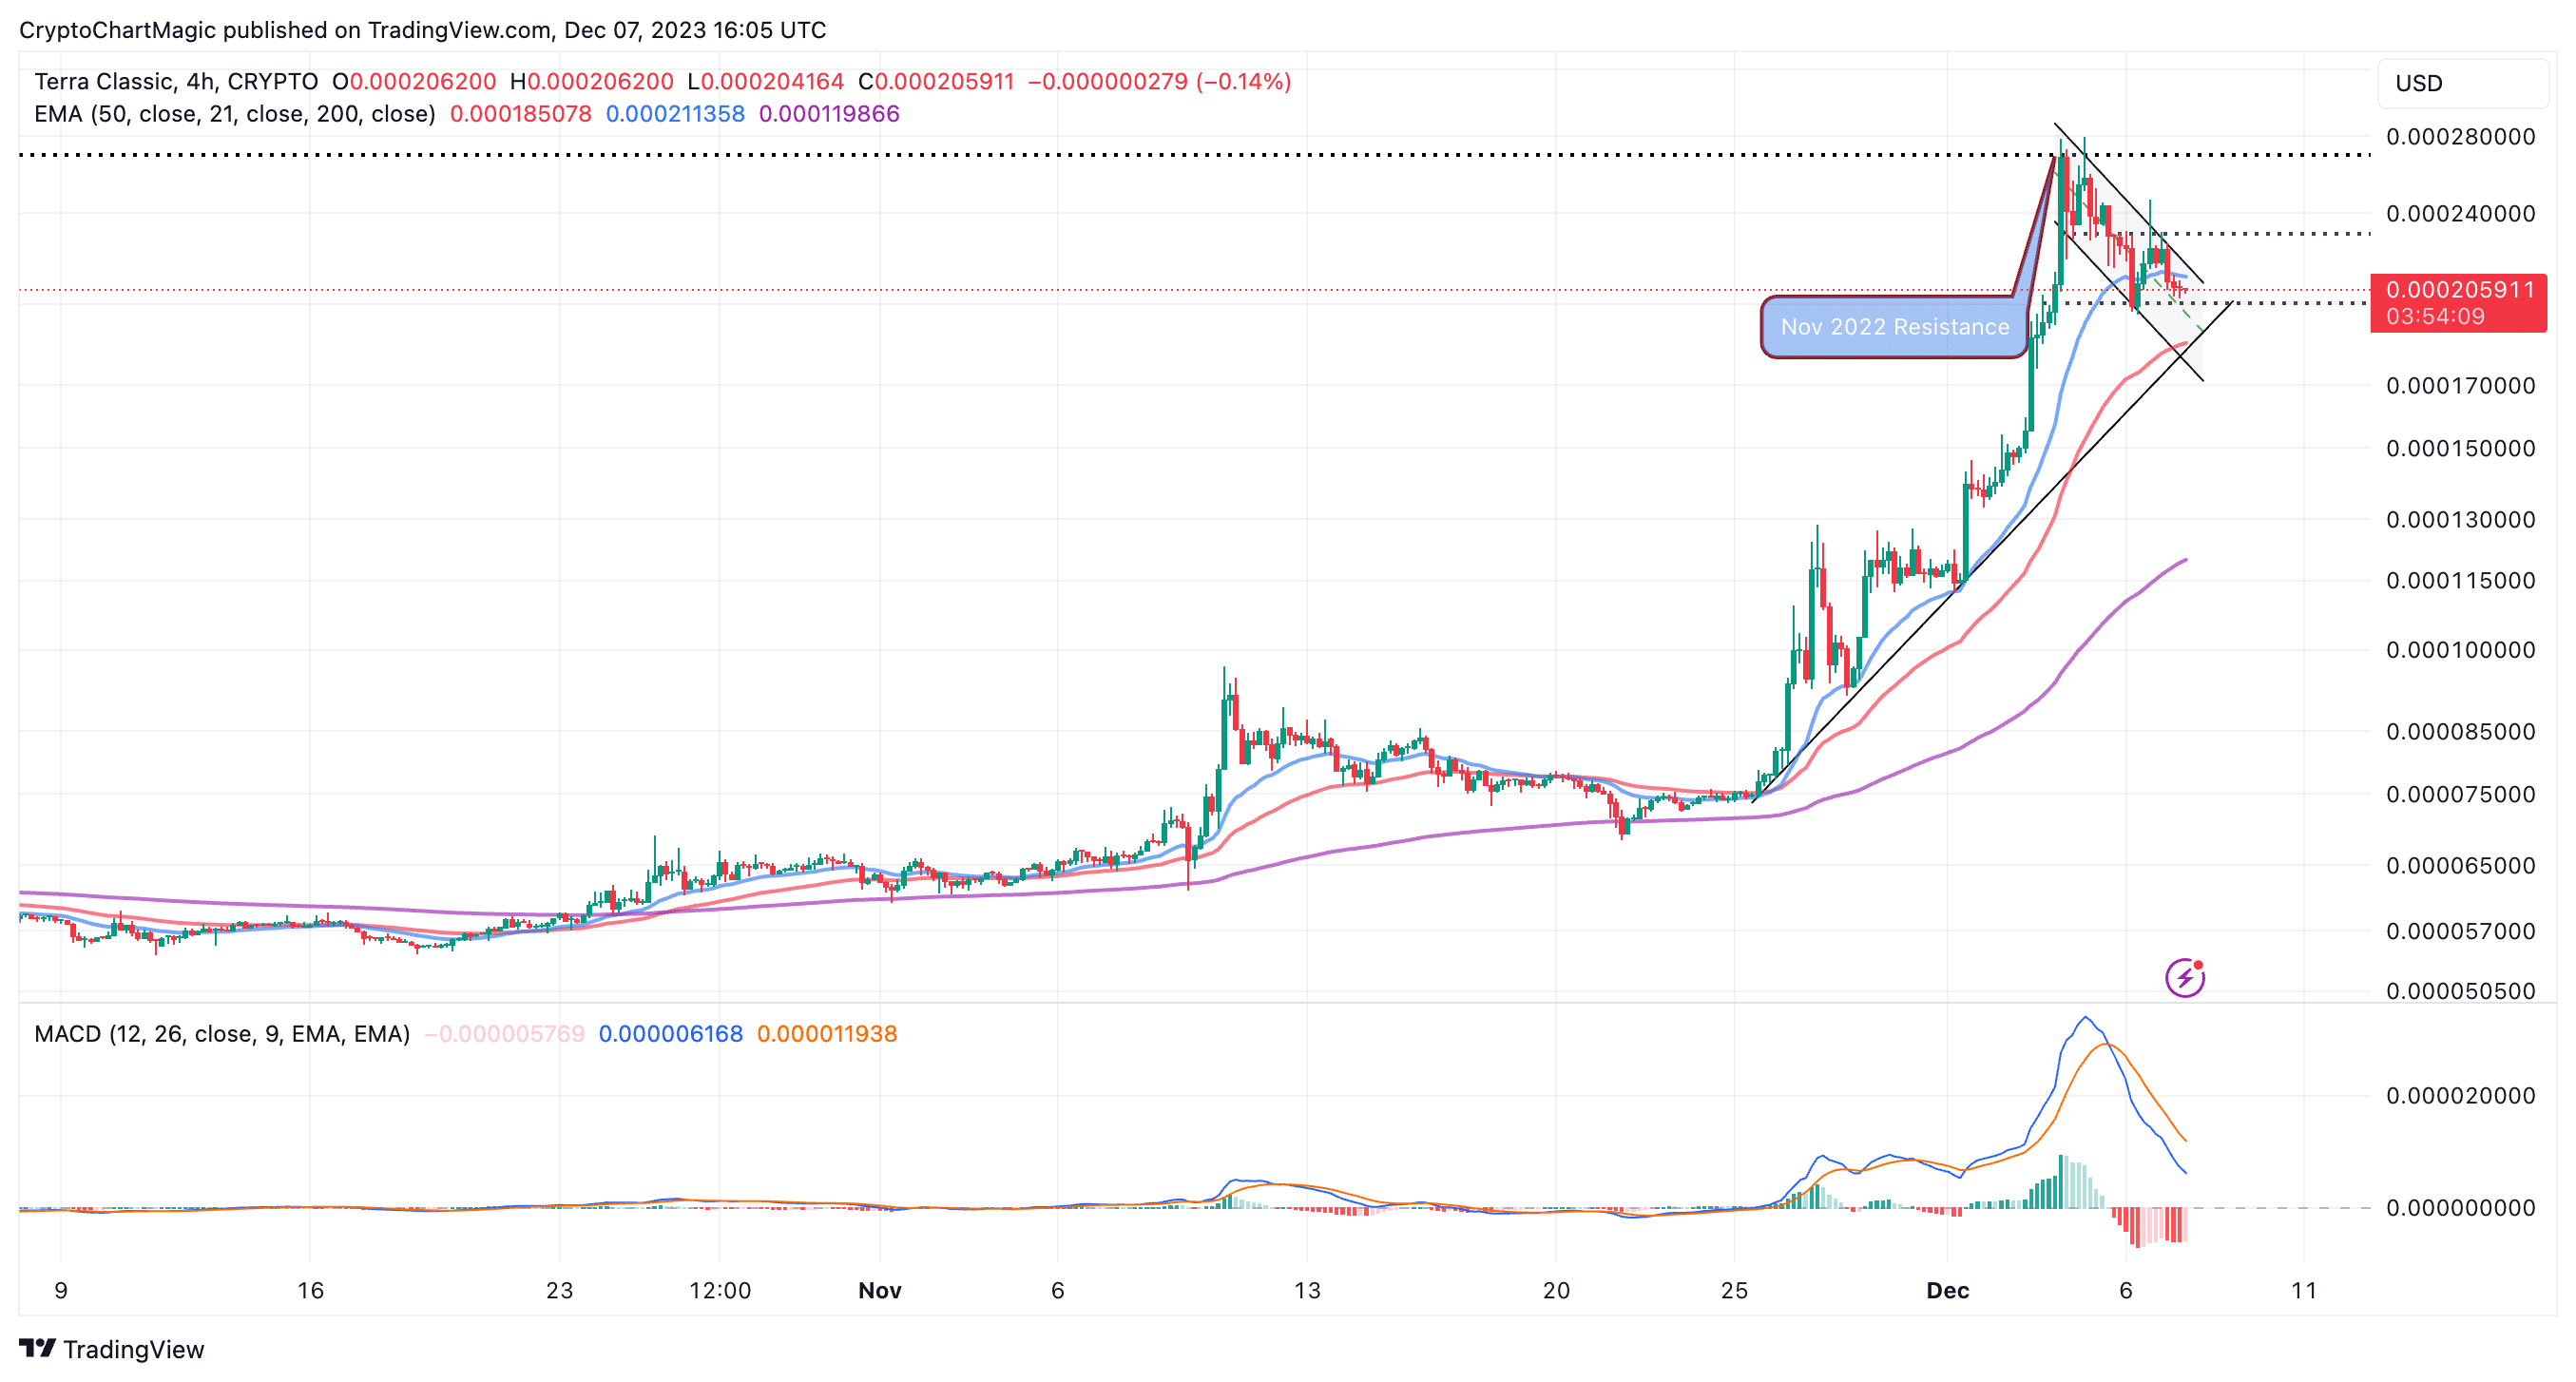
The massive rally in the Terra Classic (LUNC) price in November cooled down on December 4. Traders and investors locking in the accrued gains could be contributing to the ongoing correction, where LUNC price is seeking support at $0.0002.
Prior to the breakout to highs approximately at $0.00027, Terra Classic consolidated between support at $0.000068 and resistance at $0.000095.
As reported, a strategic proposal passed by the community and aimed at supporting the ecosystem’s tokens LUNC and TerraClassicUSD (USTC) drove up interest in the token, resulting in a commendable rally. Binance also contributed to the surge as it burned more LUNC tokens.
Can Terra Classic (LUNC) Price Hold $0.0002 Support?
The ongoing pullback is taking place in a descending channel. If sustained, Terra Classic price might restest a two-week-long ascending trendline, where bulls will have a chance to push for a reversal.
However, an immediate recovery could prove impossible with the Moving Average Convergence Divergence (MACD) indicator sending a sell signal in the four-hour time frame.
What is apparent is the consolidation in the channel but, the next action from here would depend on the support LUNC receives.
The 50 Exponential Moving Average (EMA) (red) highlighted additional support close to $0.00018. Declines below this level may trigger a larger sell-off as panic spreads, compelling investors to sell to protect gains made.
Traders looking forward to entering new long positions in LUNC may want to wait until the token springboards from the support areas highlighted above, including the immediate $0.0002, and the 50 EMA which almost coincides with the ascending trendline at $0.00018.
The 21 EMA (blue) limits the Terra Classic recovery push alongside the upper boundary of the channel. Some key levels to watch closely while trading LUNC are $0.00022, the most recent high at $0.00027, and subsequently the resistance at $0.0003.
Although a bullish thesis exists in the daily time frame, this could change any time soon if the MACD sends a sell signal. Sell signals in this indicator manifest with the blue MACD line sliding below the red signal line while the trend changes downwards.
Bullish crossovers from the moving average could ultimately save Terra Classic price from the danger of falling to $0.0001. The 50-day EMA(red) has recently crossed above the 200-day EMA (purple), forming a golden cross.
Another golden cross recently came into the picture after the 21-day EMA flipped above the 200-day EMA, suggesting that Terra Classic has a higher chance of resuming the uptrend for gains to $0.0003 than falling to $0.0001.
Related Articles
- Is BitTorrent (BTT) Price Rally A Classic Pump and Dump? Here’s What You Should Know
- Analyst Predicts An Approaching Bitcoin Price Slump Will Benefit Altcoins
- Top 3 Meme Coins To Buy In December For 2024: DOGE, BONK and Optimus AI
Recent Posts
- Price Analysis
Will Solana Price Hit $150 as Mangocueticals Partners With Cube Group on $100M SOL Treasury?
Solana price remains a focal point as it responds to both institutional alignment and shifting…
- Price Analysis
SUI Price Forecast After Bitwise Filed for SUI ETF With U.S. SEC – Is $3 Next?
SUI price remains positioned at a critical intersection of regulatory positioning and technical structure. Recent…
- Price Analysis
Bitcoin Price Alarming Pattern Points to a Dip to $80k as $2.7b Options Expires Today
Bitcoin price rebounded by 3% today, Dec. 19, reaching a high of $87,960. This rise…
- Price Analysis
Dogecoin Price Prediction Points to $0.20 Rebound as Coinbase Launches Regulated DOGE Futures
Dogecoin price has gone back to the spotlight as it responds to the growing derivatives…
- Price Analysis
Pi Coin Price Prediction as Expert Warns Bitcoin May Hit $70k After BoJ Rate Hike
Pi Coin price rose by 1.05% today, Dec. 18, mirroring the performance of Bitcoin and…
- Price Analysis
Cardano Price Outlook: Will the NIGHT Token Demand Surge Trigger a Rebound?
Cardano price has entered a decisive phase as NIGHT token liquidity rotation intersects with structural…