Shiba Inu Price Analysis: Is the $0.000007 Support Enough to Hold?


Shiba Inu Price Analysis: While the market leaders Bitcoin and Ethereum show a temporary halt in the recovery phase, the major cryptocurrencies witnessed additional selling pressure and turned sideways. One of them is a popular memecoin Shiba Inu showing sideways over the past two weeks and developing a descending triangle pattern. This pattern could offer a better conviction for potential price behavior in the near future.
Also Read: Shiba Inu News: Shibarium Release Fuels BONE Price 35% Rally, Eyes $3 In Weeks
Shiba Inu Price Daily Chart:
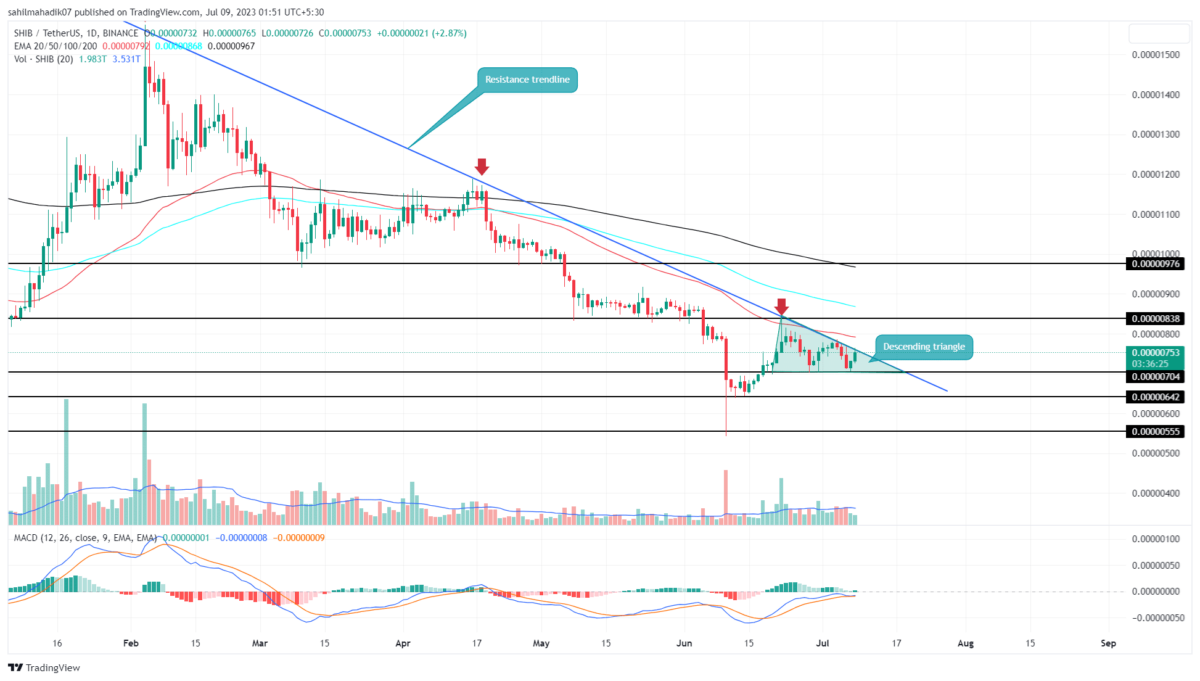
- The $0.000007 stands as strong support for SHIB buyers
- A breakout above the overhead trendline will trigger a significant upswing
- The intraday trading volume of the Shiba Inu coin is $146.2 Million, showing a 16% gain.
 Source- Tradingview
Despite a volatile phase in the crypto market, the Shiba Inu price continues to wobble between two chart levels, which are long-coming resistance trendlines and $0.000007 horizontal support. This overhead resistance constantly offering dynamic resistance pressurizes the memecoin to make new lower highs.
In the daily chart, this consolidation is revealed as the formation of a famous bearish pattern called a descending triangle. A breakdown below the pattern’s neckline will accelerate the selling pressure if the prices breach neckline support.
Thus, with a higher possibility to break $0.000007 support, the SHIB price could tumble 8.5% down to hit $0.00000642.
When Can You Buy Shiba Inu?
As no trend remains intact, the Shiba Inu price may eventually break free from the ongoing downfall. However, interested buyers must for the prices to breach the overhead resistance trendline. This breakout will signal a change in trend, projecting an early target at $0.00000838, followed by $0.00000976.
- Moving Average Convergence Divergence: The rising MACD slopes reflect the buyer’s attempt to retake control, but the formation of a lower high indicates these attempts are getting undermined.
- Exponential Moving Average: The 50-day EMA dynamic resistance offers strong resistance to the SHIB price.
Why Trust CoinGape
CoinGape has covered the cryptocurrency industry since 2017, aiming to provide informative insights Read more…to our readers. Our journal analysts bring years of experience in market analysis and blockchain technology to ensure factual accuracy and balanced reporting. By following our Editorial Policy, our writers verify every source, fact-check each story, rely on reputable sources, and attribute quotes and media correctly. We also follow a rigorous Review Methodology when evaluating exchanges and tools. From emerging blockchain projects and coin launches to industry events and technical developments, we cover all facets of the digital asset space with unwavering commitment to timely, relevant information.
Related Articles


- ‘XRP Will Continue to Be at the Heart’: Ripple Reaffirms Commitment to Token
- CLARITY Act Failure Could Stall the 2026 Crypto Bull Run, Warns Bitwise CIO
- BTC Price May Rally if Fed Prints Money to Stabilize Japan, Says Arthur Hayes
- Trump Says Interest Rates Will Come Down Once Fed Chair Is Replaced
- Why Monad Token Price is Up Today?
- Shiba Inu Price Outlook As SHIB Burn Rate Explodes 2800% in 24 Hours
- Pi Network Price Prediction as 134M Token Unlock in Jan 2026 Could Mark a New All-Time Low
- Bitcoin Price Outlook as US Dollar Index Hits 4-Year Low, Gold Soars
- Stock Market Today: Nasdaq, Dow, S&P 500 Futures Rise Ahead of Fed Meeting, and Jobless Claims
- Bitcoin And XRP Price Prediction Ahead of FOMC Meeting Today, Jan 28
- XRP Price Prediction as Ripple Scores Big Partnership in Cash-Rich Saudi Arabia


