Shiba Inu Price Analysis: Is the $0.000007 Support Enough to Hold?
Shiba Inu Price Analysis: While the market leaders Bitcoin and Ethereum show a temporary halt in the recovery phase, the major cryptocurrencies witnessed additional selling pressure and turned sideways. One of them is a popular memecoin Shiba Inu showing sideways over the past two weeks and developing a descending triangle pattern. This pattern could offer a better conviction for potential price behavior in the near future.
Also Read: Shiba Inu News: Shibarium Release Fuels BONE Price 35% Rally, Eyes $3 In Weeks
Shiba Inu Price Daily Chart:
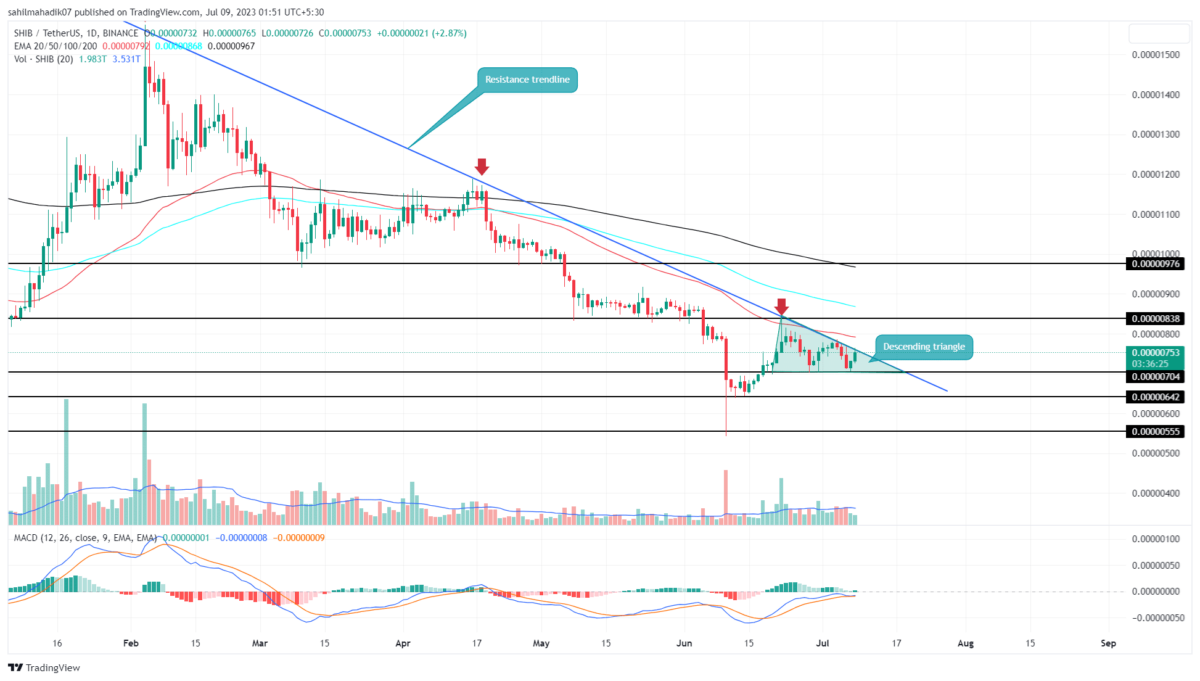
- The $0.000007 stands as strong support for SHIB buyers
- A breakout above the overhead trendline will trigger a significant upswing
- The intraday trading volume of the Shiba Inu coin is $146.2 Million, showing a 16% gain.
Despite a volatile phase in the crypto market, the Shiba Inu price continues to wobble between two chart levels, which are long-coming resistance trendlines and $0.000007 horizontal support. This overhead resistance constantly offering dynamic resistance pressurizes the memecoin to make new lower highs.
In the daily chart, this consolidation is revealed as the formation of a famous bearish pattern called a descending triangle. A breakdown below the pattern’s neckline will accelerate the selling pressure if the prices breach neckline support.
Thus, with a higher possibility to break $0.000007 support, the SHIB price could tumble 8.5% down to hit $0.00000642.
When Can You Buy Shiba Inu?
As no trend remains intact, the Shiba Inu price may eventually break free from the ongoing downfall. However, interested buyers must for the prices to breach the overhead resistance trendline. This breakout will signal a change in trend, projecting an early target at $0.00000838, followed by $0.00000976.
- Moving Average Convergence Divergence: The rising MACD slopes reflect the buyer’s attempt to retake control, but the formation of a lower high indicates these attempts are getting undermined.
- Exponential Moving Average: The 50-day EMA dynamic resistance offers strong resistance to the SHIB price.
Recent Posts
- Price Analysis
Bitcoin Price on Edge as $24B Options Expire on Boxing Day — Is $80K About to Crack?
Bitcoin enters the final stretch of the year with the price behavior signaling a decisive…
- Price Analysis
Crypto Market Rebounds: Are Bulls Positioning for a Santa Rally?
The crypto market showed signs of recovery on Christmas Day, gaining 0.67% in the…
- Price Analysis
XRP, Bitcoin, Ethereum Price Predictions Ahead of Jan 2026 CLARITY Act and US Crypto Reserve Plans
The XRP, Bitcoin, and Ethereum prices remained in a bear market after falling by over…
- Price Analysis
Pi Network Analysis: Pi Coin Price Surges on Christmas Eve, Can It Hit Year-End Highs?
Pi coin price reflect cautious positioning as market structure tightens near a key base. The…
- Price Analysis
Why Dec 26th Is A Do Or Die for Bitcoin Price Ahead Of Record Options Expiry?
As Christmas winds down, the Bitcoin price dipped 0.74% to around $86,750. Market participants…
- Price Analysis
Why Bitcoin, Ethereum And XRP Prices Are Down Today? (24 Dec)
The crypto market extended losses ahead of Christmas as Bitcoin, Ethereum, and XRP slipped further…