Is Worldcoin Price Ready to Bounce Back? Chart Pattern Hints a Rally to $3
After the massive rally witnessed on the July 24th launch date, the Worldcoin(WLD) witnessed a sharp reversal to stabilize its price action. By the press time, the WLD price trades at $2.35 and is roughly 68% down from its market debut peak of $7.50. Currently, the price trend has turned sideways wobbling around the $2 mark. Will the recovery continue after this consultation?
Also Read: Worldcoin (WLD) Under Probe by French Regulators
Worldcoin Price Daily Chart
- A broadening wedge pattern leads the current rally in Worldcoin price
- A positive crossover between the 50-and-100-day EMA slope could accelerate the buying pressure among traders.
- The intraday trading volume in Worldcoin is $155.6 Million, indicating a 6.5% loss.
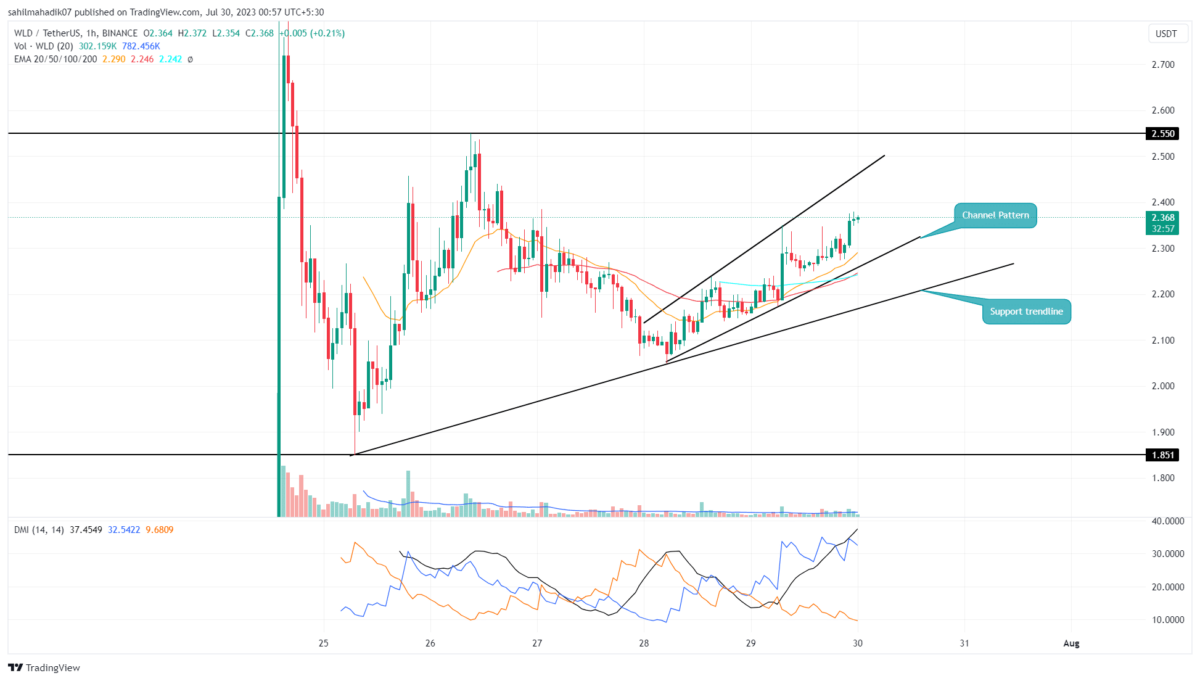
The Worldcoin price clearly reflects a sideways trend with the higher low and lower high formation in the hourly time frame chart. After the recent price surge, this consolidation is crucial for a sustained bullish trend as it could absorb the build-up selling pressure, and check sustainability at higher levels.
As of now, the coin price shows a steady recovery rally under the influence of a broadening channel pattern. The prices are constantly wiggling with rising trend lines and approaching the $2.55 swing high resistance.
If the chart pattern remains intact, and offers dynamic support to coin buyers, the WLD price could challenge the $2.55 for a bullish breakout. Reclaiming this swing high would be an early sign for uptrend continuation and may drive a rally to the next significant resistance around $2.92-$3.
Can Worldcoin Price Plunge Back to $1.85?
The hourly chart shows the two rising trendlines are currently supporting the Worldcoin price rally. The steeper one is the lower trendline of the broadening channel and the second is drawn connecting the lows of July 25th and 28th. Considering a pessimistic situation, a breakdown below the channel support trendline will be an early sign of the continuation of the sideways trend, However, a crackdown below the longer trendline could prolong the correction phase and may plunge the Worldcon price back to $1.85
- Exponential moving average: The rising EMAs(20, 50, 100, and 200) offer additional support to a rising price.
- Directional Movement Index: A significant gap between the DI+(blue) and DI-(orange) slope in a positive crossover state indicates bullish momentum is aggressive.
Recent Posts
- Price Analysis
Pi Coin Price Prediction as Expert Warns Bitcoin May Hit $70k After BoJ Rate Hike
Pi Coin price rose by 1.05% today, Dec. 18, mirroring the performance of Bitcoin and…
- Price Analysis
Cardano Price Outlook: Will the NIGHT Token Demand Surge Trigger a Rebound?
Cardano price has entered a decisive phase as NIGHT token liquidity rotation intersects with structural…
- Price Analysis
Will Bitcoin Price Crash to $74K as Japan Eyes Rate Hike on December 19?
Bitcoin price continues to weaken after breaking below its recent consolidation range, now trading within…
- Price Analysis
Bitwise Predicts Solana Price Will Hit New All-Time Highs in 2026
Solana price declined by 4% over the past 24 hours, breaking below the key $130…
- Price Analysis
Bitcoin Price Outlook: Capriole Founder Warns of a Drop Below $50K by 2028
Bitcoin price narratives continue to evolve as long-term downside risks regain attention. Bitcoin price discussions…
- Price Analysis
XRP Price Rare Pattern Points to a Surge to $3 as ETFs Cross $1B Milestone
XRP price dropped by 1.2% today, Dec. 17, continuing a downward trend that started in…