Is XRP Price Headed Lower to $0.5?


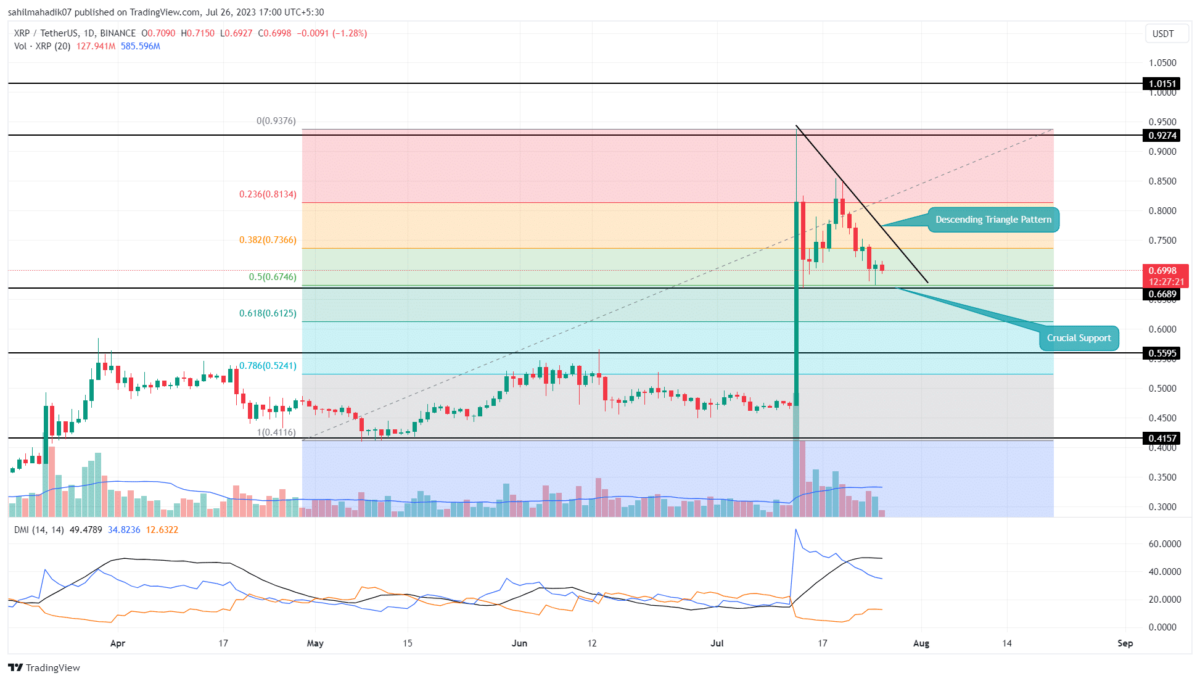
For nearly two weeks XRP price has remained in a correction phase. This retracement came after the massive rally on July 14th, where XRP price made a yearly high of $0.938. As of now, XRP is wobbling between a downslopping resistance trendline and $0.669 support, indicating the formation of a descending triangle pattern. Here’s how this pattern could further influence this altcoin of near future growth.
Also Read: XRP, DOGE Among Top Altcoins In Market Depth Spike After Ripple Ruling
XRP Price Daily Chart
- A Low volume pullback in XRP price indicates the ongoing correction is temporary.
- A bullish breakout from overhead resistance could signal the continuation of the recovery rally.
- The intraday trading volume in the XRP is $1.6 Billion, indicating a 15% loss.
 Source: Tradingview
Amid the recent downturn in the crypto market, the XRP price has dropped 21% in a week and plunged to the local support of $0.669. This horizontal support aligned with the 50% Fibonacci retracement level creates a strong footing for buyers.
In the last two days, the daily chart shows candles with lower price rejections accentuating the buyers are defending their new reclaimed support. This demand pressure could trigger a bullish reversal and bolster the bulls to rechallenge the overhead trendline.
As the triangle pattern is formed in the correction phase of a larger uptrend, the XRP price is more likely to pierce the resistance trendline and resume prevailing recovery.
The post-breakout rally could revisit the last swing high of $0.927, and surpass it for the $1.015 milestone.
[converter id=”xrp-xrp” url=”https://coingape.com/price/converter/xrp-to-usd/?amount=1″]
Is XRP Price Poised for Longer Correction?
If the correction mode in pioneer cryptocurrency Bitcoin continues to pressurize altcoins, the XRP sellers trigger a breakdown below the $0.0669 neckline. The crackdown could accelerate the selling pressure and prolong the downward trend to $0.613, followed by $6 psychological support.
- Fibonacci retracement level: A retracement to 50% FIB level is often considered healthy for a long-term bullish trend.
- Directional moving index: the DI+(blue) and Di-(Orange) lines are gradually nearing a bearish crossover indicating increasing supply pressure in the market.

Why Trust CoinGape
CoinGape has covered the cryptocurrency industry since 2017, aiming to provide informative insights Read more…to our readers. Our journal analysts bring years of experience in market analysis and blockchain technology to ensure factual accuracy and balanced reporting. By following our Editorial Policy, our writers verify every source, fact-check each story, rely on reputable sources, and attribute quotes and media correctly. We also follow a rigorous Review Methodology when evaluating exchanges and tools. From emerging blockchain projects and coin launches to industry events and technical developments, we cover all facets of the digital asset space with unwavering commitment to timely, relevant information.
Related Articles


- Is Bhutan Selling Bitcoin? Government Sparks Sell-Off Concerns as BTC Crashes
- ‘XRP Treasury’ VivoPower Abandons Crypto Strategy Amid Market Crash, Stock Price Dumps
- Bitcoin Crashes to $65K as Crypto Market Erases $2T in Market Cap Since October Record High
- Trump’s World Liberty Financial Dumps Bitcoin as BTC Falls Back to 2021 ATH
- CLARITY Act Markup Still On Course as Senate Puts Crypto Bill on Schedule, Lummis Assures
- Dogecoin, Shiba Inu, and Pepe Coin Price Prediction as Bitcoin Crashes Below $70K.
- BTC and XRP Price Prediction As Treasury Secretary Bessent Warns “US Won’t Bail Out Bitcoin”
- Ethereum Price Prediction As Vitalik Continues to Dump More ETH Amid Crypto Crash
- Why XRP Price Struggles With Recovery?
- Dogecoin Price Prediction After SpaceX Dogecoin-Funded Mission Launch in 2027
- Solana Price Crashes Below $95 for the First Time Since 2024: How Low Will SOL Go Next?


