Key Levels to Watch as SHIB Price Hints Fresh Recovery From $0.0000075


The ongoing correction in SHIB price has found suitable support at $0.000007 walking close to the 61.8 Fibonacci retracement level. Within a week, the coin price bounced twice from this support indicating a compelling level of interest from investors seeking to accumulate at a discounted price. Is this demand pressure sufficient to kick-start a new recovery rally?
Also Read: Tangem Releases Next Batch of Shiba Inu Hardware Wallets
Shiba Inu Daily Chart: Key Points
- The increasing demand pressure near $0.0000075 set the SHIB price for a 12.5% upswing
- The overhead resistance of $0.00000936 could bolster a sideways trend in this memecoin
- The intraday trading volume of the Shiba Inu coin is $208.8 Million, showing a 28% gain.
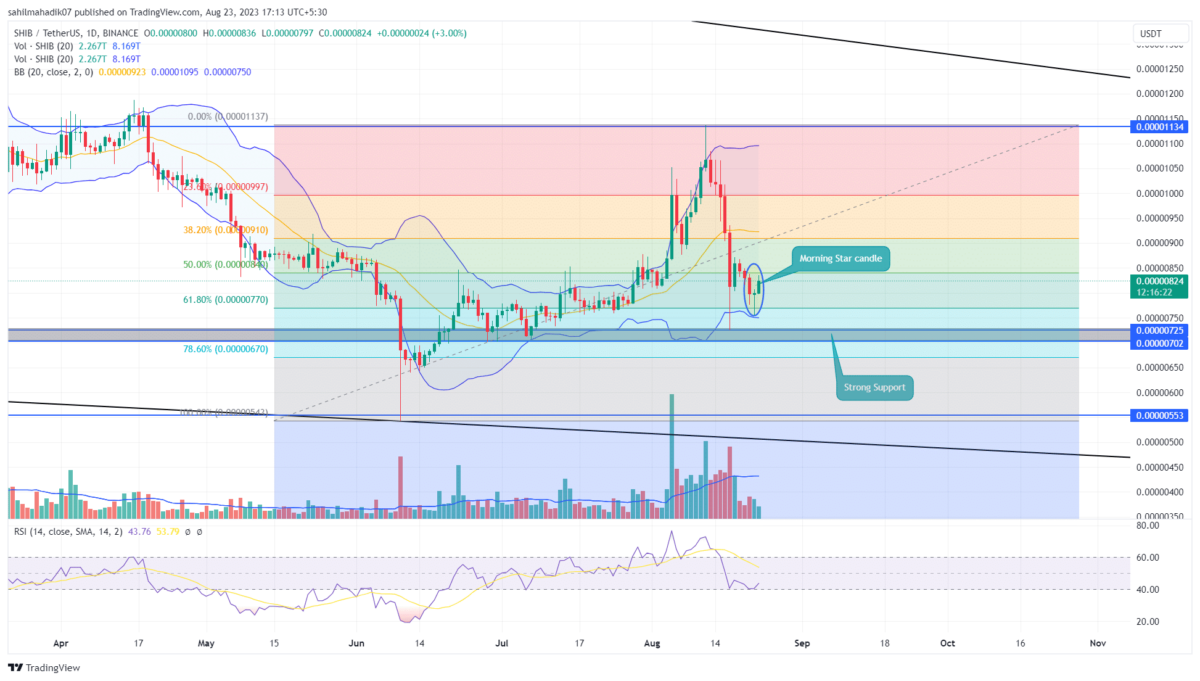
 Source- Tradingview
As of the time of writing, the SHIB price is trading at $0.00000833, marking an intraday gain of 4%. The daily chart presents a notable formation of the morning star candle pattern often interpreted as a potential reversal signal. Should this pattern indeed manifest as intended, it could serve as a catalyst to propel the coin’s price to higher levels.
If current bullish momentum persists, Shiba Inu coin could potentially witness a 12.5% increase, positioning it to challenge the high of $0.0000093 recorded on August 17th. This particular level is worth mentioning due to the substantial red candle that appeared on the daily chart during that time, accompanied by high trading volume.
This combination suggests a significant show of conviction from sellers, underscoring the importance of overcoming this resistance level to solidify a recovery.
Therefore, a breakout rally beyond this level could drive the Shiba Inu coin approximately 21% higher, setting the stage to hit the $0.00001134 mark
Will the Shiba Inu Coin Prolong Correction Trend?
For nearly a week, the Shiba Inu coin has traded within the range of the August 17th candle. Considering this sideway as the formation of a range-bound movement, the high($0.00000936) and low($0.00000725) of the above-mentioned candle project strong resistance, and support respectively. Contrary to the bullish outlook, the breakdown below the $0.00000725 mark will extend the ongoing correction.
- Bollinger Band: The lower band of the Bollinger band indicator going flattish near $0.00000725 gives additional support to buyers
- Relative Strength Index: The daily RSI slope sustainability above the 40% mark reflects enough bullish momentum for a rebound,

Why Trust CoinGape
CoinGape has covered the cryptocurrency industry since 2017, aiming to provide informative insights Read more…to our readers. Our journal analysts bring years of experience in market analysis and blockchain technology to ensure factual accuracy and balanced reporting. By following our Editorial Policy, our writers verify every source, fact-check each story, rely on reputable sources, and attribute quotes and media correctly. We also follow a rigorous Review Methodology when evaluating exchanges and tools. From emerging blockchain projects and coin launches to industry events and technical developments, we cover all facets of the digital asset space with unwavering commitment to timely, relevant information.
Related Articles


- $40B Bitcoin Airdrop Error: Bithumb to Reimburse Customer Losses After BTC Crash To $55k
- ETH Price Fears Major Crash As Trend Research Deposits $1.8B Ethereum to Binance
- Trump Tariffs: Will US–India Trade Deal Boost Crypto Market?
- Why Is Pi Coin Price Rising Today? Key Reasons Explained
- BestChange Wins Best Crypto Exchange Rate Aggregator at the Crypto Impact Awards 2025
- Bitcoin and XRP Price Outlook Ahead of Crypto Market Bill Nearing Key Phase on Feb 10th
- Bitcoin Price Prediction as Funding Rate Tumbles Ahead of $2.1B Options Expiry
- Ethereum Price Outlook as Vitalik Buterin Sells $14 Million Worth of ETH: What’s Next for Ether?
- Solana Price at Risk of Crashing Below $50 as Crypto Fear and Greed Index Plunges to 5
- Pi Network Price Prediction Ahead of PI KYC Validator Reward System Launch
- XRP Price Outlook As Peter Brandt Predicts BTC Price Might Crash to $42k


