Key Levels to Watch as ETH Price Enters Consolidation Mode


After a considerable sell-off in the first half of August, the crypto market has been witnessing high volatility. For over a week, the daily chart showed multiple short-bodied candles in the top two cryptocurrencies, Bitcoin and Ethereum reflecting an uncertain market sentiment. However, Amid this indecisiveness, the ETH price wobbling between two horizontal levels reflects the formation of range bound pattern which could assist in predicting near-future projections
Also Read: ETH 2.0 Deposits Hit ATH As Perpetual Futures Open Interest Dips
Ethereum Daily Chart: Key Points
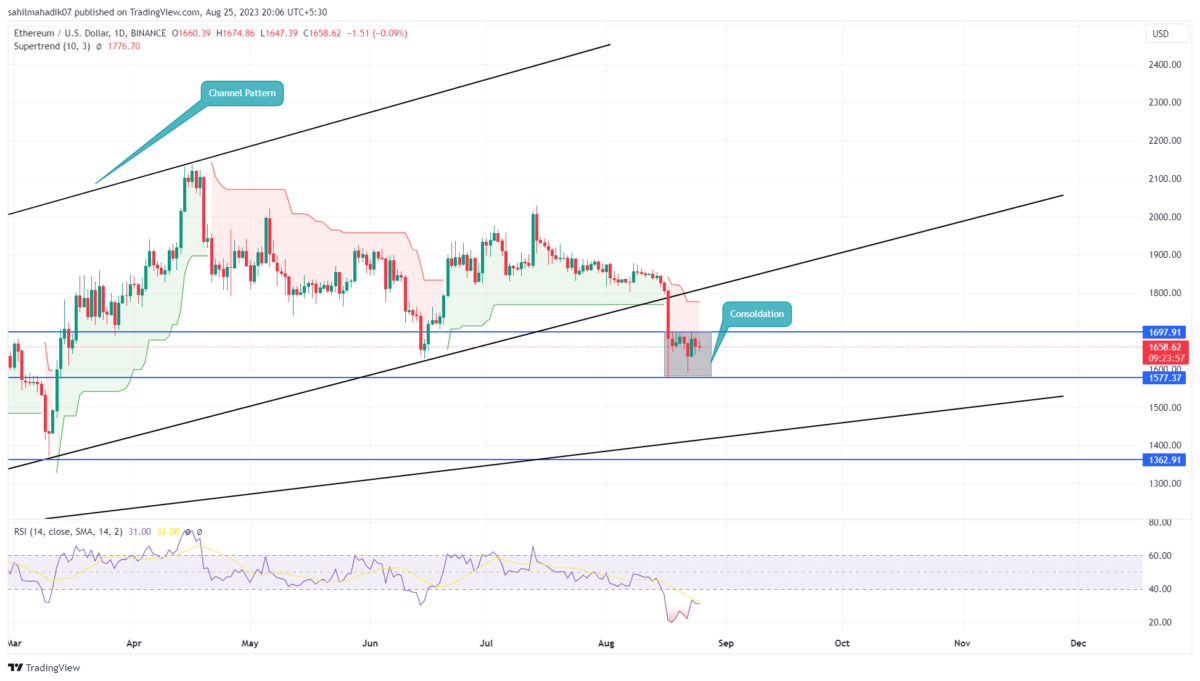
- The area between the $1700 and $1577 horizontal level can be considered a no-trading zone.
- A bullish breakout from $1700 could trigger a 6.5% upswing in ETH price
- The intraday trading volume in Ether is $5.2 Billion, indicating a 15% loss.
 Source- Tradingview
Over the past eight days, the Ethereum price has resonated between creating a narrow range in the daily time frame chart. This consolidation came after a significant fall indicating the sellers must be recuperating the exhausted bearish momentum to resume the previous fall.
By the press time, the second largest cryptocurrency traded at $1660 with an intraday loss of 0.27%. If the bearish market sentiment continues, the coin sellers may rechallenge the bottom support of $1577.
A potential breakdown from this support will hint at the resumption of the downward trend and may push the prices to the $1500-1450 demand zone. In addition, the falling prices may also meet a rising trendline at the aforementioned support, indicating a higher possibility of a bullish reversal.
[converter id=”eth-ethereum” url=”https://coingape.com/price/converter/eth-to-usd/?amount=1″]
Can ETH Price Reclaim $1700 Mark?
As earlier reported by Coingape, the Ethereum price is witnessing increased whale activity near the $1650 mark. The presence of high accumulation from below may bolster buyers to challenge the $1700 resistance. A bullish breakout from this barrier will trigger a bullish pullback in a downward trend which could push the price back to $1800. However, until the buyers break above the August 17th high of $1809, the bearish outlook will remain intact.
- Relative Strength Index: The daily RSI slope rising above the oversold region accentuates the rising buying pressure from traders.
- Supertrend: A red paint projected in the daily chart reflects a negative trend in the market.

Why Trust CoinGape
CoinGape has covered the cryptocurrency industry since 2017, aiming to provide informative insights Read more…to our readers. Our journal analysts bring years of experience in market analysis and blockchain technology to ensure factual accuracy and balanced reporting. By following our Editorial Policy, our writers verify every source, fact-check each story, rely on reputable sources, and attribute quotes and media correctly. We also follow a rigorous Review Methodology when evaluating exchanges and tools. From emerging blockchain projects and coin launches to industry events and technical developments, we cover all facets of the digital asset space with unwavering commitment to timely, relevant information.
Related Articles


- Why is XRP Price Dropping Today?
- Breaking: FTX’s Sam Bankman-Fried (SBF) Seeks New Trial Amid Push For Trump’s Pardon
- Fed’s Hammack Says Rate Cuts May Stay on Hold Ahead of Jobs, CPI Data Release
- $800B Interactive Brokers Launches Bitcoin, Ethereum Futures via Coinbase Derivatives
- Michael Saylor Says Strategy Won’t Sell Bitcoin Despite Unrealized Loss, Will Keep Buying Every Quarter
- Bitcoin Price Analysis Ahead of US NFP Data, Inflation Report, White House Crypto Summit
- Ethereum Price Outlook As Vitalik Dumps ETH While Wall Street Accumulates
- XRP Price Prediction Ahead of White House Meeting That Could Fuel Clarity Act Hopes
- Cardano Price Prediction as Bitcoin Stuggles Around $70k
- Bitcoin Price at Risk of Falling to $60k as Goldman Sachs Issues Major Warning on US Stocks
- Pi Network Price Outlook Ahead of This Week’s 82M Token Unlock: What’s Next for Pi?


