Key Levels to Watch as ETH Price Enters Consolidation Mode
After a considerable sell-off in the first half of August, the crypto market has been witnessing high volatility. For over a week, the daily chart showed multiple short-bodied candles in the top two cryptocurrencies, Bitcoin and Ethereum reflecting an uncertain market sentiment. However, Amid this indecisiveness, the ETH price wobbling between two horizontal levels reflects the formation of range bound pattern which could assist in predicting near-future projections
Also Read: ETH 2.0 Deposits Hit ATH As Perpetual Futures Open Interest Dips
Ethereum Daily Chart: Key Points
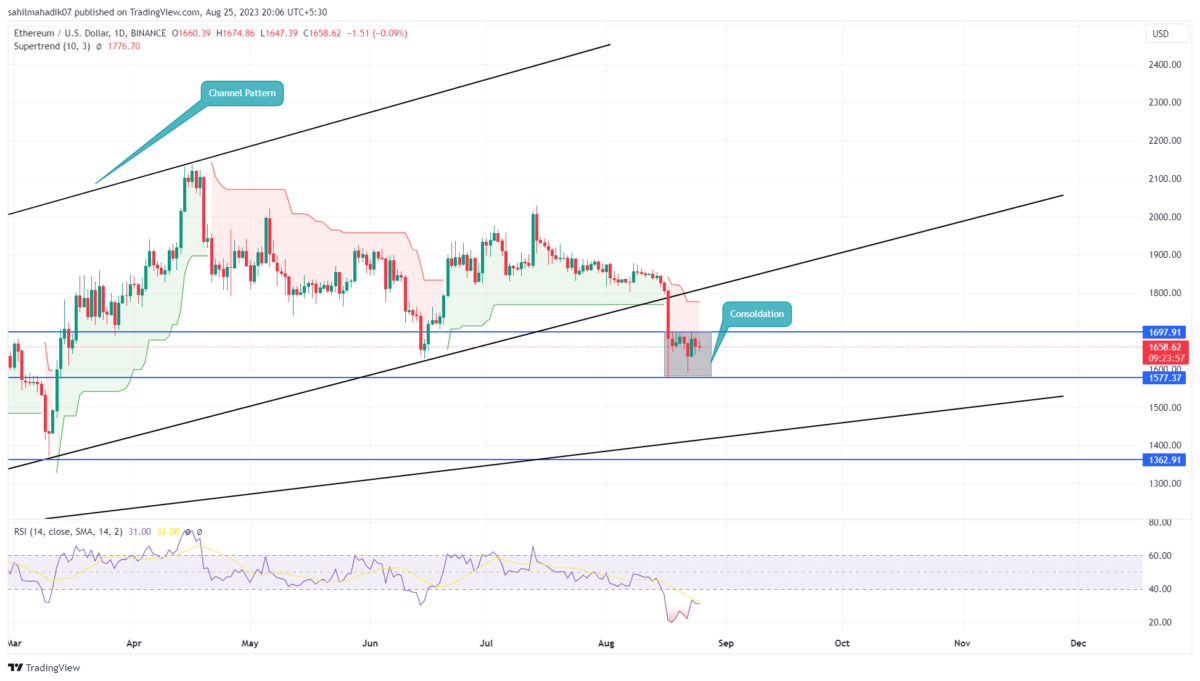
- The area between the $1700 and $1577 horizontal level can be considered a no-trading zone.
- A bullish breakout from $1700 could trigger a 6.5% upswing in ETH price
- The intraday trading volume in Ether is $5.2 Billion, indicating a 15% loss.
Over the past eight days, the Ethereum price has resonated between creating a narrow range in the daily time frame chart. This consolidation came after a significant fall indicating the sellers must be recuperating the exhausted bearish momentum to resume the previous fall.
By the press time, the second largest cryptocurrency traded at $1660 with an intraday loss of 0.27%. If the bearish market sentiment continues, the coin sellers may rechallenge the bottom support of $1577.
A potential breakdown from this support will hint at the resumption of the downward trend and may push the prices to the $1500-1450 demand zone. In addition, the falling prices may also meet a rising trendline at the aforementioned support, indicating a higher possibility of a bullish reversal.
[converter id=”eth-ethereum” url=”https://coingape.com/price/converter/eth-to-usd/?amount=1″]
Can ETH Price Reclaim $1700 Mark?
As earlier reported by Coingape, the Ethereum price is witnessing increased whale activity near the $1650 mark. The presence of high accumulation from below may bolster buyers to challenge the $1700 resistance. A bullish breakout from this barrier will trigger a bullish pullback in a downward trend which could push the price back to $1800. However, until the buyers break above the August 17th high of $1809, the bearish outlook will remain intact.
- Relative Strength Index: The daily RSI slope rising above the oversold region accentuates the rising buying pressure from traders.
- Supertrend: A red paint projected in the daily chart reflects a negative trend in the market.
Recent Posts
- Price Analysis
Bitcoin Price Prediction As Michael Saylor Pauses BTC Purchase- Is A Fall to $74k Imminent?
Michael Saylor's Strategy has paused additional BTC purchases while increasing cash reserves, prompting renewed speculation…
- Price Analysis
Aster launched Phase 5 Buyback Program Allocating 80% Fees. Will ASTER Price Rally?
Aster price hovered above $0.70 following a 2.67% daily gain, supported by a bullish market…
- Price Analysis
XRP Price Prediction: Rare Bullish Patterns Align With Powerful Catalysts
The XRP price has stabilized in the past few days as it jumped by ~9%…
- Price Analysis
Weekly Crypto Price Prediction: Bitcoin, Ethereum, and XRP as Market Momentum Builds
As Christmas week begins, the crypto market shows early signs of recovery. Over the past…
- Price Analysis
Will Solana Price Hit $150 as Mangocueticals Partners With Cube Group on $100M SOL Treasury?
Solana price remains a focal point as it responds to both institutional alignment and shifting…
- Price Analysis
SUI Price Forecast After Bitwise Filed for SUI ETF With U.S. SEC – Is $3 Next?
SUI price remains positioned at a critical intersection of regulatory positioning and technical structure. Recent…