Key Levels to Watch as ETH Price Revisits Multi-Month Support


In the face of escalating selling pressure throughout the altcoin sector, the ETH price trajectory experienced a pronounced decline, pulling back sharply from its resistance near the $1745 mark. This dip which occurred over a mere fortnight recorded a 10.5% loss and wiped out the entire gain of September. Could this mounting bearish pressure drive Ether below the $1500 threshold?
Also Read: 10 Largest Ethereum Wallets Hold With Diamond Hands Despite ETH Exchange Inflows
Will ETH Price Rebound from $1500?
- The ETH price could witness high demand pressure at $1500
- The Ethereum fear and greed index at 42% reflects neutral to bearish sentiment in the market.
- The intraday trading volume in Ether is $5.3 Billion, indicating a 0.8% gain.
 Source- Tradingview
Currently, the Ethereum price is trading at $1,556, reflecting a 0.73% dip within the day. Should this downward momentum continue, this altcoin could further descend by approximately 3%, targeting the confluence of the $1,500 level and a longstanding support trendline that delineates a rising wedge pattern.
This particular support has its origins dating back to June 2022 and has consistently served as a pivotal accumulation point during a major market retracement. Hence, as the ETH price approaches this crucial juncture, it’s plausible to expect a resurgence in buying interest around the $1,500 mark.
If the coin price manages to firmly anchor above this level, the bullish traders might seize this opportunity to catalyze a recovery. In alignment with the structure of the rising wedge pattern, a bullish pivot from this support is anticipated to propel the ETH price toward the pattern’s upper trendline.
In an optimistic scenario, the altcoin might undergo a substantial rally, potentially breaching the year-high $2,238.
[converter id=”eth-ethereum” url=”https://coingape.com/price/converter/eth-to-usd/?amount=1″]
ETH vs BTC Performance
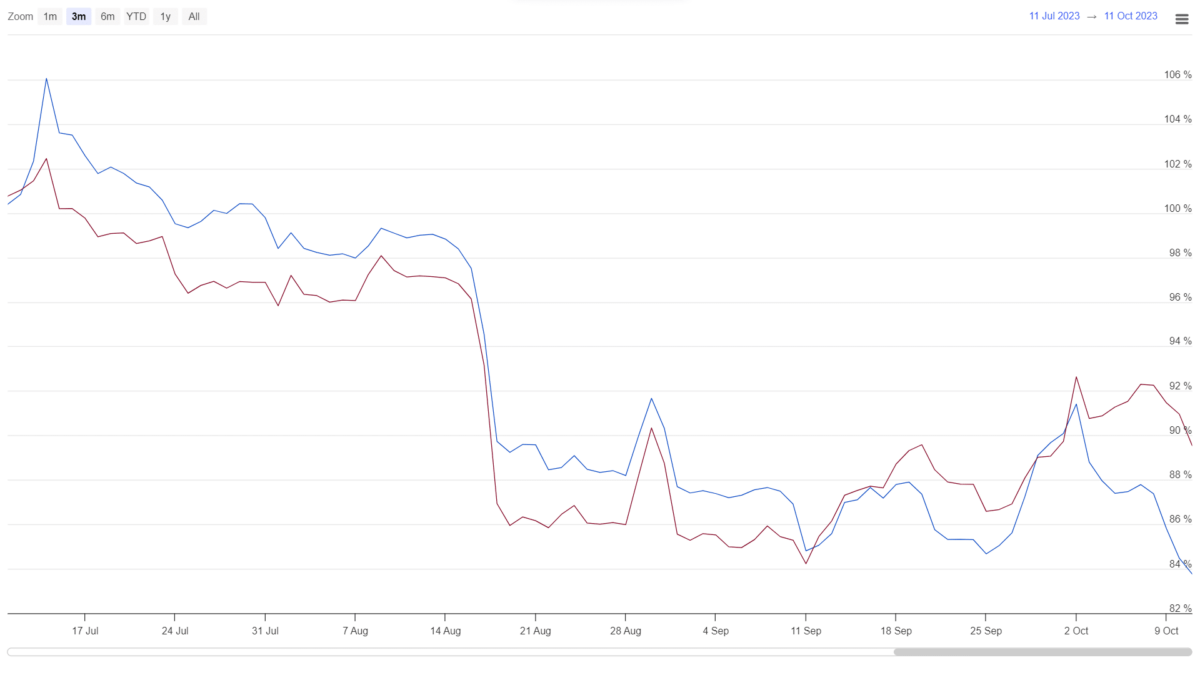 Source: Coingape| Ethereum Vs Bitcoin Price
A comparison analysis of the past couple of months reveals that the Ethereum coin has lagged behind the leading cryptocurrency Bitcoin in terms of performance. Since mid-September, Bitcoin price embarked on a new relief rally, whereas the ETH price demonstrated a more horizontal price movement. In addition, this altcoin has witnessed a steep correction with the recent downturn.
- Relative Strength Index: The daily RSI slope breakdown below 40% indicates aggressive bearish momentum in the market.
- Exponentially Moving Average: A bearish alignment between the daily EMAs(20, 50, 100, and 200) reflects an overall bearish trend.

Why Trust CoinGape
CoinGape has covered the cryptocurrency industry since 2017, aiming to provide informative insights Read more…to our readers. Our journal analysts bring years of experience in market analysis and blockchain technology to ensure factual accuracy and balanced reporting. By following our Editorial Policy, our writers verify every source, fact-check each story, rely on reputable sources, and attribute quotes and media correctly. We also follow a rigorous Review Methodology when evaluating exchanges and tools. From emerging blockchain projects and coin launches to industry events and technical developments, we cover all facets of the digital asset space with unwavering commitment to timely, relevant information.
Related Articles


- India’s Crypto Taxation Unchanged as the Existing 30% Tax Retains
- Crypto News: Strategy Bitcoin Underwater After 30% BTC Crash
- Expert Predicts Ethereum Crash Below $2K as Tom Lee’s BitMine ETH Unrealized Loss Hits $6B
- Bitcoin Falls Below $80K as Crypto Market Sees $2.5 Billion In Liquidations
- Top Reasons Why XRP Price Is Dropping Today
- Here’s Why MSTR Stock Price Could Explode in February 2026
- Bitcoin and XRP Price Prediction After U.S. Government Shuts Down
- Ethereum Price Prediction As Vitalik Withdraws ETH Worth $44M- Is a Crash to $2k ahead?
- Bitcoin Price Prediction as Trump Names Kevin Warsh as new Fed Reserve Chair
- XRP Price Outlook Ahead of Possible Government Shutdown
- Ethereum and XRP Price Prediction as Odds of Trump Attack on Iran Rise


