Litecoin Price Analysis: Will $LTC Price Rally Continue to $150?


Litecoin Price Analysis: Amid the increasing bullish momentum in the crypto market, the Litecoin price witnessed a massive surge on June 30th. This rally could be associated with news that the Canadian government gives approval for unlimited trading of Litecoin (LTC) along with three other cryptocurrencies. Moreover, the long bullish candle recorded 28% growth and breached two important resistance of $103.2 and a downsloping resistance trendline. But can this breakout trigger a new uptrend in LTC price or is it a bull trap?
Also Read: Litecoin (LTC) Ousts Solana to Reclaim Top 10 Spot
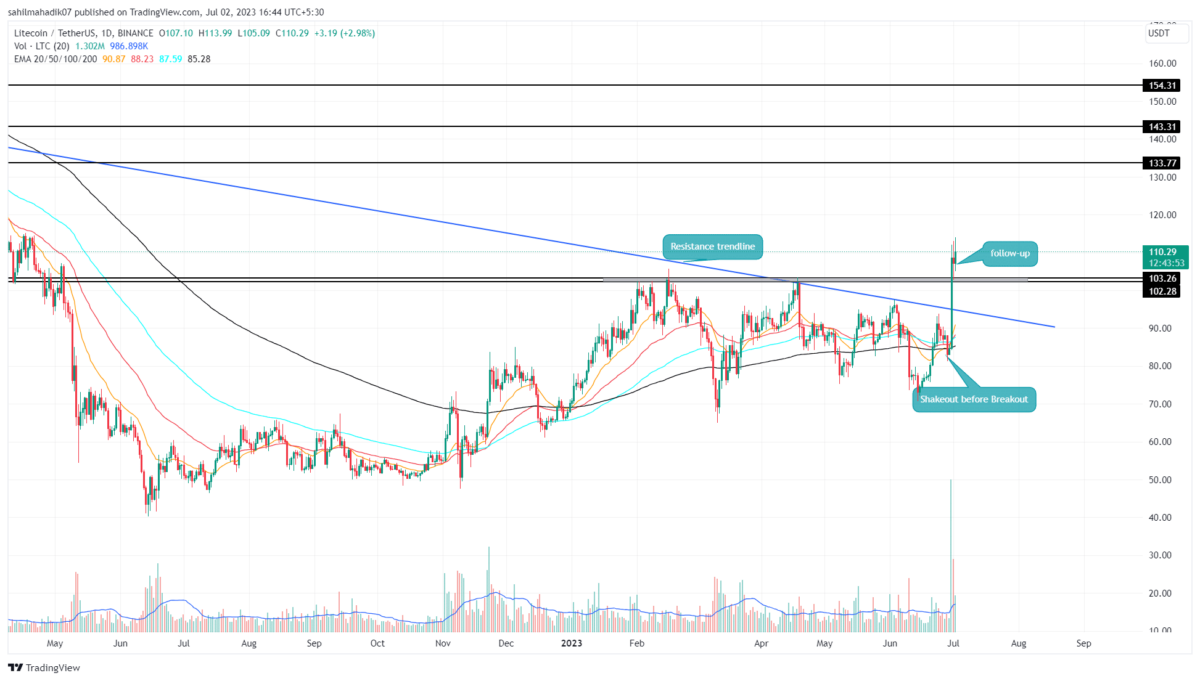
Litecoin Price Daily Chart
- The $103.2-$102.2 resistance breakout set the Litecoin price for a 28% upswing
- The coin holders can maintain a bullish outlook until the coin price is sustained above the breached trendline
- The 24-hour trading volume in the Litecoin coin is $1.63 Million, marking a 49.5% loss.
 Source-Tradingview
The Litecoin price reclaiming the $100 psychological mark with the recent breakout caught the eyes of several market participants. The technical chart also reflects some action that indicates a high possibility of a genuine breakout.
Before this breakout, the LTC price showed a downswing around the 4th week of June, these drops are usually shakeouts where the weekends get eliminated and strong players get better entry. Moreover, the high volume in this breakout reflects the buyers’ conviction to rise higher.
Yesterday, the coin price showed a countertrend move(retest to breached resistance) and sustained above the $103.2 level. The lower price rejection at this flipped barrier indicates the buyers defending the new support.
By the press time, the Litecoin price traded at the $109.8 mark and showed a suitable follow-up with 2.53%. With sustained buying the price could rise 21.5% to hit the next significant resistance of $133.7.
Will Litecoin Price Reach $140?
After an aggressive price rally, the Litecoin price is likely to show some consolidation or pullback before continuing with the bullish trend. For coin holders, the breached $103.2-$102, and downsloping trendline are two crucial support that buyers should to maintain a bullish outlook. If the bullish momentum persists, the post-breakout rally may drive the coin price to a potential target of $133.7, followed by $143.3, and $154.3
- Relative Strength Index: The daily RSI slope surged above the 60% mark indicating high momentum buying in the market.
- Average Directional Index: An uptick in ADX slope near the 25% mark reflects the strength in buyers to lead a prolonged.

Why Trust CoinGape
CoinGape has covered the cryptocurrency industry since 2017, aiming to provide informative insights Read more…to our readers. Our journal analysts bring years of experience in market analysis and blockchain technology to ensure factual accuracy and balanced reporting. By following our Editorial Policy, our writers verify every source, fact-check each story, rely on reputable sources, and attribute quotes and media correctly. We also follow a rigorous Review Methodology when evaluating exchanges and tools. From emerging blockchain projects and coin launches to industry events and technical developments, we cover all facets of the digital asset space with unwavering commitment to timely, relevant information.
Related Articles


- Will Bitcoin Crash Again as ‘Trump Insider’ Whale Dumps 6,599 BTC
- XRP News: Ripple’s RLUSD Gets Boost as CFTC Expands Approved Tokenized Collateral
- Crypto Markets Brace as Another Partial U.S. Government Shutdown Looms Next Week
- $40B Bitcoin Airdrop Error: Bithumb to Reimburse Customer Losses After BTC Crash To $55k
- ETH Price Fears Major Crash As Trend Research Deposits $1.8B Ethereum to Binance
- Cardano Price Prediction as Midnight Token Soars 15%
- Bitcoin and XRP Price Outlook Ahead of Crypto Market Bill Nearing Key Phase on Feb 10th
- Bitcoin Price Prediction as Funding Rate Tumbles Ahead of $2.1B Options Expiry
- Ethereum Price Outlook as Vitalik Buterin Sells $14 Million Worth of ETH: What’s Next for Ether?
- Solana Price at Risk of Crashing Below $50 as Crypto Fear and Greed Index Plunges to 5
- Pi Network Price Prediction Ahead of PI KYC Validator Reward System Launch


