Litecoin Price Strikes Multi-Month Resistance, Is It Safe To Enter?
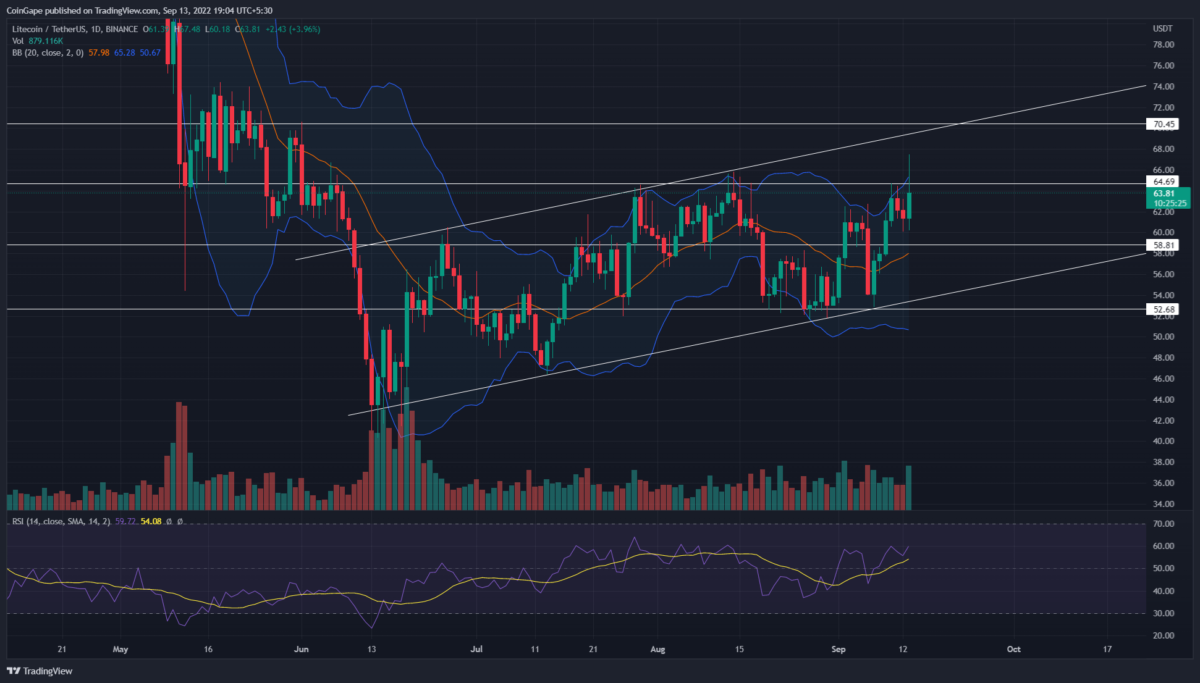
A rising parallel channel pattern governs the ongoing recovery in LTC/USDT pair. The recent bull cycle within this pattern was initiated when the coin price rebounded from the shared support of $52.7 and ascending trendline. However, the Litecoin price is struggling to surpass the $64.7 resistance . Click here to know how this chart pattern may influence litecoin’s future price.
Key points:
- The rising Litecoin price has halted at monthly resistance of $64.7 as the market condition witnesses a sudden selling pressure.
- The bullish recovery regains the 100-day EMA slope.
- The intraday trading volume in the Litecoin coin is $828.5 Million, indicating a 47.5% gain.
A bullish recovery from $52.7 support drove the prices 24.5% higher to hit a record high of $67.5. Thus, the technical chart shows the Litecoin price has breached the multiple-month resistance of $64.7. This resistance level reverted the price several times over the past three months.
Thus, a bullish breakout from this barrier with a suitable rise in volume activity will offer a long opportunity for interest traders. Anyhow, traders must wait for a daily candle closing above this resistance which may surge the Litecoin prices to the $70.5 mark.
However, by the press time, it seems the crypto market is facing sudden selling pressure due to the unexpected number in the consumer price index(CPI). As a result, Bitcoin has dropped 4.3% and Ethereum 5.4%.
Similarly, the Litecoin price has reverted below the mentioned resistance and lost most of its intraday gains. Thus, a long-wick rejection at the aforementioned important resistance($64.7) is unfavorable for buyers as it may further encourage a bearish reversal.
A potential reversal could pull the prices 7% lower to hit the local support of $58.8. Anyhow, the rising channel pattern is a bearish contention pattern, indicating the Litecoin price is eventually poised for a significant correction.
Thus, this pattern’s bullish breakout upper trendline will release the Bitcoin price from a bearish threat.
Technical indicator
Bollinger band indicator: similar to $64.7 resistance, the coin price shows rejections signs at the upper band of this pattern. Such signals usually result in price reversal to the midline support.
RSI: the indicator value at 60% suggests the overall market sentiment of Litecoin is bullish.
- Resistance Levels: $64.7 and $70.5
- Support Levels: $58.8 and $52.6
Recent Posts
- Price Analysis
Pi Coin Price Prediction as Expert Warns Bitcoin May Hit $70k After BoJ Rate Hike
Pi Coin price rose by 1.05% today, Dec. 18, mirroring the performance of Bitcoin and…
- Price Analysis
Cardano Price Outlook: Will the NIGHT Token Demand Surge Trigger a Rebound?
Cardano price has entered a decisive phase as NIGHT token liquidity rotation intersects with structural…
- Price Analysis
Will Bitcoin Price Crash to $74K as Japan Eyes Rate Hike on December 19?
Bitcoin price continues to weaken after breaking below its recent consolidation range, now trading within…
- Price Analysis
Bitwise Predicts Solana Price Will Hit New All-Time Highs in 2026
Solana price declined by 4% over the past 24 hours, breaking below the key $130…
- Price Analysis
Bitcoin Price Outlook: Capriole Founder Warns of a Drop Below $50K by 2028
Bitcoin price narratives continue to evolve as long-term downside risks regain attention. Bitcoin price discussions…
- Price Analysis
XRP Price Rare Pattern Points to a Surge to $3 as ETFs Cross $1B Milestone
XRP price dropped by 1.2% today, Dec. 17, continuing a downward trend that started in…