Low Volume Rally Hints MATIC Price to Fail $0.7 Breakout; Sell or Hold?
Over the last three weeks, the MATIC price has showcased a sustained relief rally in the 4-hour time frame chart. A series of new higher highs and lows project the short-term trend is bullish and could drive the prices back to the $0.7 mark. Is this a start of a new recovery phase or a temporary upswing before further fall?
Also Read: Polygon 2.0 Architecture Unveiled, MATIC Price Surges by 5.6%
MATIC Price Daily Chart
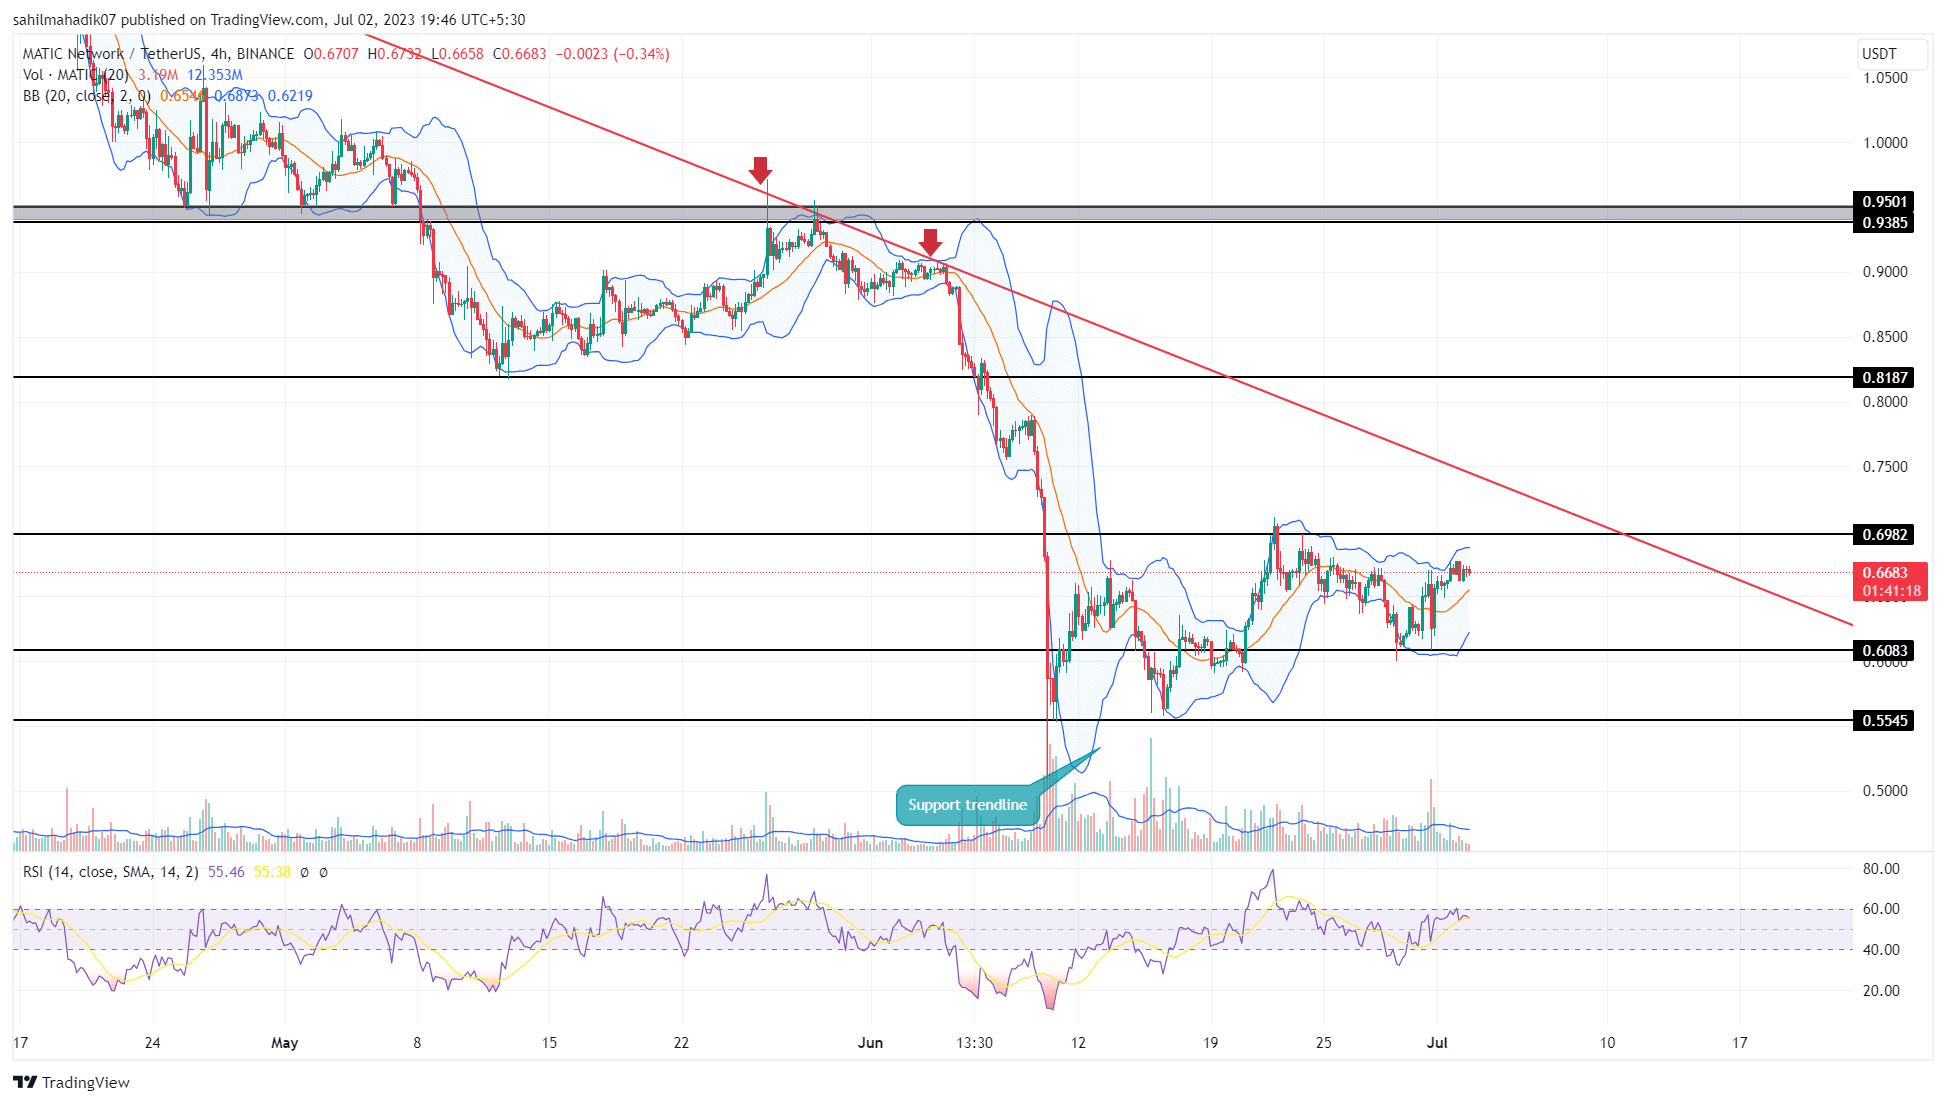
- A rising Polygon coin price could face high supply pressure at a downsloping trendline
- A significant drop in the daily RSI slope reflects the increasing bearish momentum
- The intraday trading volume in the MATIC is $232.2 Million, indicating a 20% loss.
By the press time, the Polygon coin price trades at the $0.668 mark and is gradually carrying a bullish relief rally. However, the rising prices backed by low volume indicate weakness in bullish momentum.
The ongoing rally seems temporary and holds a high possibility of reversal if met with significant resistance. With sustained buying, the MATIC price could rise 6% to reach the downsloping resistance trendline.
This dynamic resistance has been undermining buyers’ attempts for the past four months. Thus, the MATIC price is likely to turn down and continue with the downward trend.
Will MATIC Price Surpass $0.8 Mark?
If the market sentiment improves, the polygon coin buyers could give another attempt to break the overhead resistance trendline. A breakout above this resistance with daily candle closing will signal trend change and offer traders an opportunity to buy. This breached resistance flipped into potential support and could drive the MATIC price 17.5% higher to hit $0.818.
- Bollinger Band: Trading close to the upper Bollinger band, the Matic price struggles to rise above the $0.7 resistance level.
- Relative Strength Index: struggling to sustain above the 60% mark, the daily RSI slope reflects a slight increase in the bearish pressure.
Recent Posts
- Price Analysis
Bitcoin Price on Edge as $24B Options Expire on Boxing Day — Is $80K About to Crack?
Bitcoin enters the final stretch of the year with the price behavior signaling a decisive…
- Price Analysis
Crypto Market Rebounds: Are Bulls Positioning for a Santa Rally?
The crypto market showed signs of recovery on Christmas Day, gaining 0.67% in the…
- Price Analysis
XRP, Bitcoin, Ethereum Price Predictions Ahead of Jan 2026 CLARITY Act and US Crypto Reserve Plans
The XRP, Bitcoin, and Ethereum prices remained in a bear market after falling by over…
- Price Analysis
Pi Network Analysis: Pi Coin Price Surges on Christmas Eve, Can It Hit Year-End Highs?
Pi coin price reflect cautious positioning as market structure tightens near a key base. The…
- Price Analysis
Why Dec 26th Is A Do Or Die for Bitcoin Price Ahead Of Record Options Expiry?
As Christmas winds down, the Bitcoin price dipped 0.74% to around $86,750. Market participants…
- Price Analysis
Why Bitcoin, Ethereum And XRP Prices Are Down Today? (24 Dec)
The crypto market extended losses ahead of Christmas as Bitcoin, Ethereum, and XRP slipped further…