Low Volume Recovery In Solana Price Hints Potential Fall To $30
The recent sell-off in the crypto market offset the prior recovery in Solana price. The buyers currently stall this downfall at local support of $32.7, but the low volume activity in their attempts keeps the correction threat on the table. Thus, will buyers resume the bullish recovery from this support, or is further downfall on its way?
Key points from Solana price
- A bearish breakdown below the $30 support will plunge the SOL price back to the $26 bottom support.
- The 20-day EMA has flipped into potential resistance.
- The 24-hour trading volume in the Solana coin is $1.16 Billion, indicating a 31% loss.
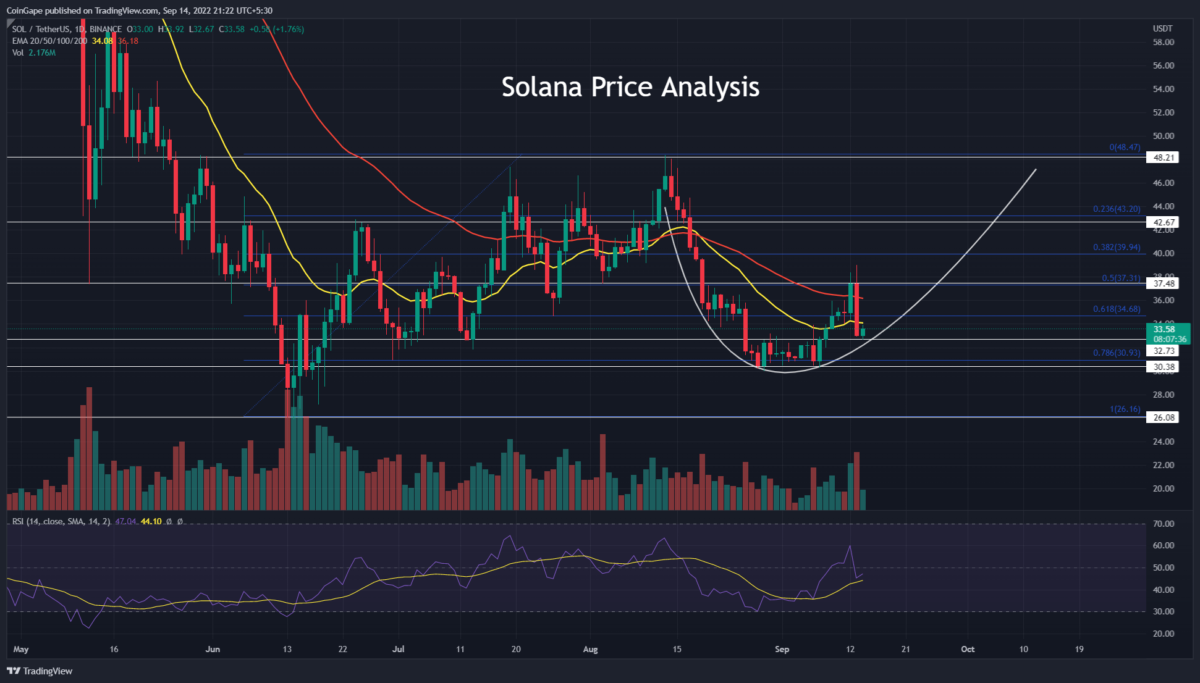
The August second-half correction has triggered a sideways rally in Solana’s daily time frame. So far, the bearish reversal has stalled at the combined support of 0.786 Fibonacci retracement level and $30.38. The replenished bullish momentum at this support surged the prices in a U-shaped pattern and accounted for a 23.7% rally.
The bull-run strikes $37.5 resistance but could not surpass it due to the sudden selling pressure on September 13th. This sell-off was triggered by the high consumer price index(CPI) data of 8.1% Y-O-Y inflation, causing a 12% fall in Solana’s price.
Thus, the bearish engulfing breached the 20-and-50-day EMA, hitting local support of $32.73. today, the Solana price is 1.64% up and gives a low volume retest to the 20-day EMA resistance. Therefore, if the selling pressure persists, the sellers breach the $32.7 support and revisit the August-September bottom support of $30.
The coin holders should keep a close watch on the price action at $30 support as a potential reversal may validate a high accumulation zone and undermine the panic-selling fall in the market.
Technical indicator
Bollinger band indicator: the Solana coin trading above the indicator’s midline indicates despite yesterday’s downfall, the market value is bullish in terms of the current price range. Moreover, this midline may act as an additional support level.
RSI indicator: the daily-RSI slope nosedive below the neutral line indicates the market sentiment is turning negative.
- Resistance level- $37.5 and $42.6
- Support levels- $32.7 and $30
Recent Posts
- Price Analysis
Pi Coin Price Prediction as Expert Warns Bitcoin May Hit $70k After BoJ Rate Hike
Pi Coin price rose by 1.05% today, Dec. 18, mirroring the performance of Bitcoin and…
- Price Analysis
Cardano Price Outlook: Will the NIGHT Token Demand Surge Trigger a Rebound?
Cardano price has entered a decisive phase as NIGHT token liquidity rotation intersects with structural…
- Price Analysis
Will Bitcoin Price Crash to $74K as Japan Eyes Rate Hike on December 19?
Bitcoin price continues to weaken after breaking below its recent consolidation range, now trading within…
- Price Analysis
Bitwise Predicts Solana Price Will Hit New All-Time Highs in 2026
Solana price declined by 4% over the past 24 hours, breaking below the key $130…
- Price Analysis
Bitcoin Price Outlook: Capriole Founder Warns of a Drop Below $50K by 2028
Bitcoin price narratives continue to evolve as long-term downside risks regain attention. Bitcoin price discussions…
- Price Analysis
XRP Price Rare Pattern Points to a Surge to $3 as ETFs Cross $1B Milestone
XRP price dropped by 1.2% today, Dec. 17, continuing a downward trend that started in…