LUNA Price Prediction: Is $78.5 Support A Buy The Dip Opportunity?


On Friday, the Terra (LUNA) price turned down from the $100 resistance forming an evening star candle pattern. The long-bearish candle showed a 13% intraday loss and breached the $93 support. Can the sellers extend the correction to $78.5 support, or will buyers step in to continue their rally?
Key points:
- The LUNA chart shows a higher price rejection candle at $93 flipped resistance
- The daily RSI chart shows negative divergence.
- The intraday trading volume in the LUNA is $3.386 Billion, indicating a 41% loss.
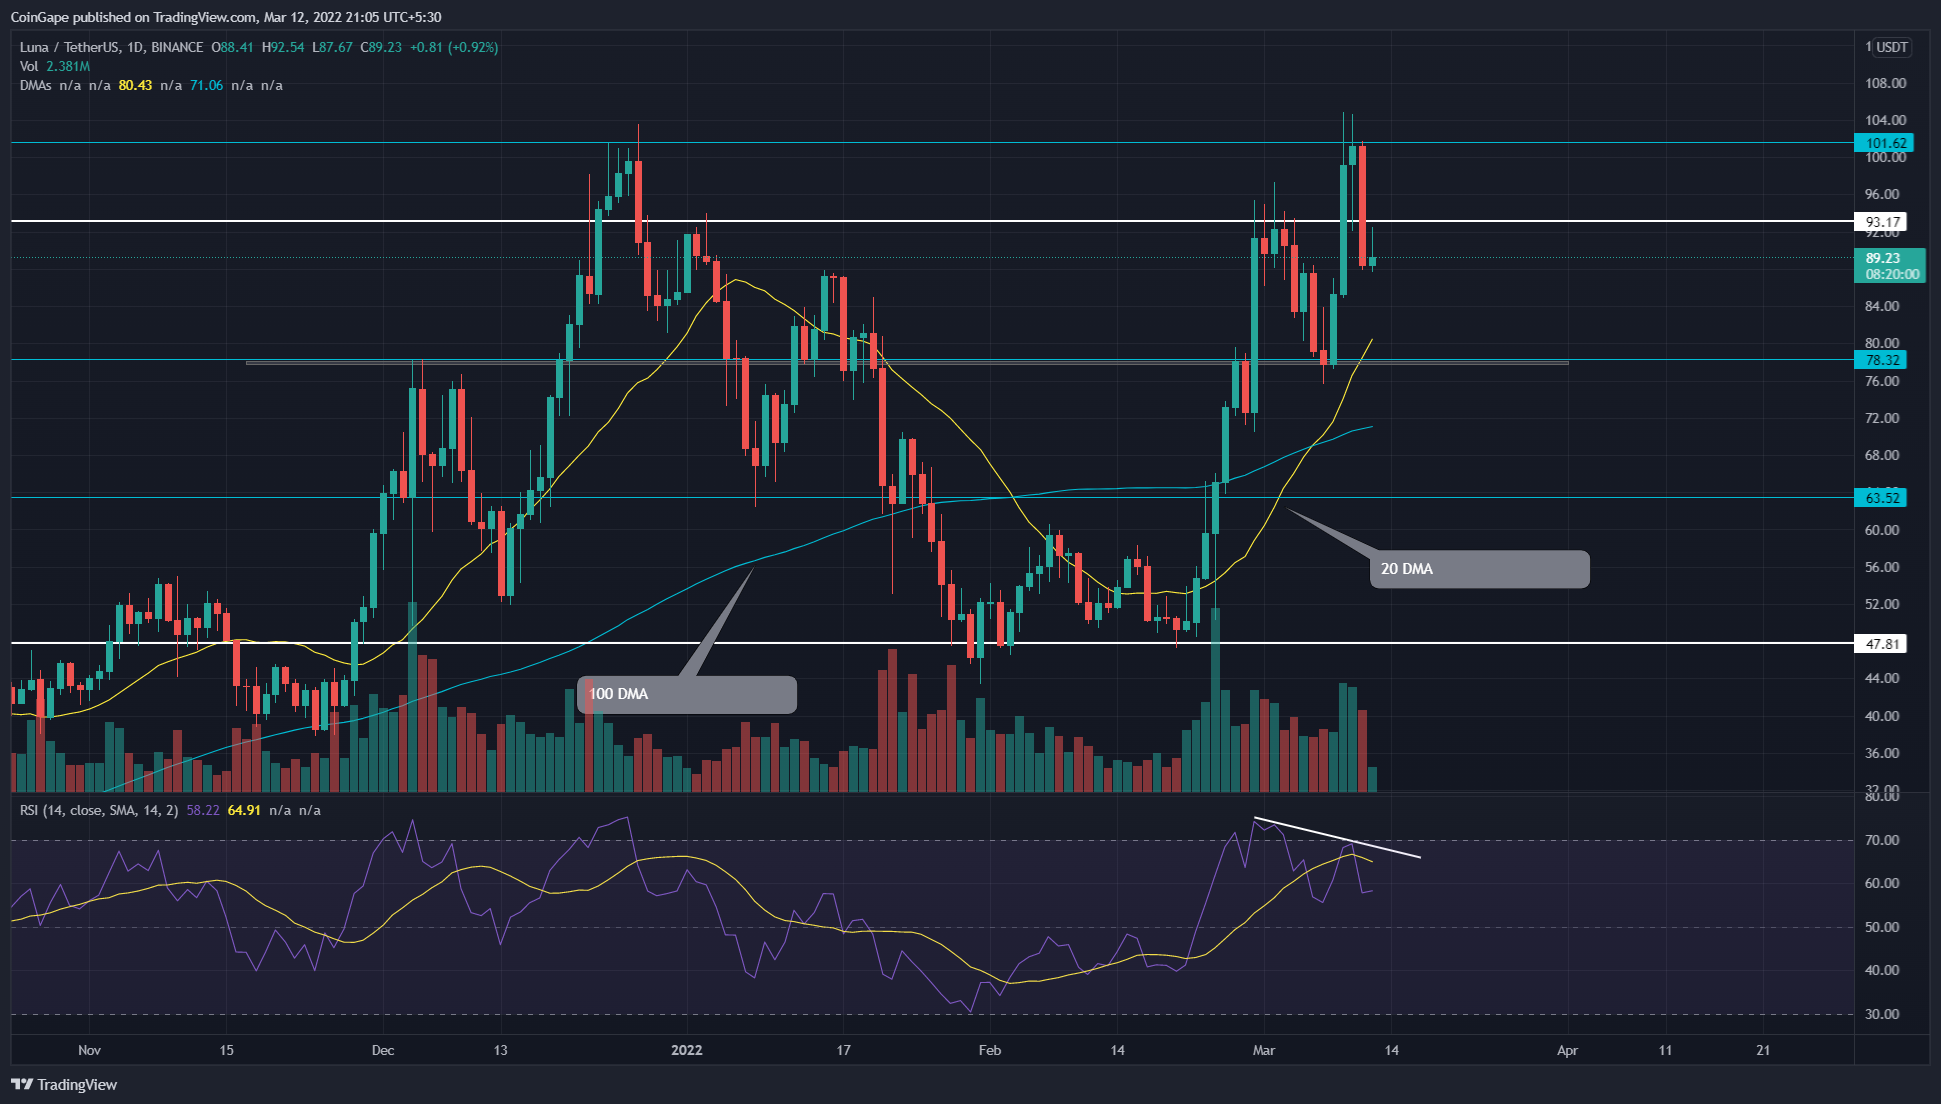 Source- Tradingview
Amid the geopolitical issue between Russia and Ukraine, the Terra coin gathered remarkable gains as February ended. The altcoin doubled from the $48 support in less than three weeks, resting the All-Time High resistance of $100.
However, the higher price rejection candle on march 9th and 10th suggested the sellers continue to defend this level with vigor. The follow-up reversal breached the immediate support of $93, displaying an evening star candle pattern.
Today, the retest phase shows a long-wick rejection candle indicating the intense supply pressure at the higher levels.
The renewed selling could plunge the altcoin by 12%, bringing it to $78.5. However, a confluence of other technical support, i.e., 20 DMA and 0.5 Fibonacci retracement level, suggests the buyers would mount a strong defense at this mark.
On a contrary note, if buyers pushed the coin price above the $93 mark. The resulting fakeout will encourage buyers to rechallenge the $100 resistance.
- Resistance levels: $93 and $100
- Support levels: $78.5 and $63
Technical indicator
A bearish divergence in the daily-Relative Strength Index (73) bolsters a pullback to the following support($78.5)
However, the recovery rally reclaimed a bullish sequence among the DMAs(20, 50, 100, and 200). These DMA lines could assist buyers in continuing the bullish rally.

Why Trust CoinGape
CoinGape has covered the cryptocurrency industry since 2017, aiming to provide informative insights Read more…to our readers. Our journal analysts bring years of experience in market analysis and blockchain technology to ensure factual accuracy and balanced reporting. By following our Editorial Policy, our writers verify every source, fact-check each story, rely on reputable sources, and attribute quotes and media correctly. We also follow a rigorous Review Methodology when evaluating exchanges and tools. From emerging blockchain projects and coin launches to industry events and technical developments, we cover all facets of the digital asset space with unwavering commitment to timely, relevant information.

Related Articles


- XRP News: Jane Street Emerges Among Key Institutions Driving XRP ETF Inflows
- Bhutan Gov. Dumps More Bitcoin Amid $410M Institutional Sell-Off in BTC ETFs
- Crypto Market in Panic Mode Ahead of Bitcoin, ETH, XRP, SOL Options Expiry & US CPI Today
- Digital Assets Are Fixed In The Future Of Traditional Finance
- U.S. CFTC Committee Appoint Ripple, Coinbase, Robinhood CEOs to Boost Crypto Regulation
- XRP and Ethereum Price Prediction as Trump Seeks to Lower Key Tariffs
- Solana Price Prediction as $2.6 Trillion Citi Expands Tokenized Products to SOL
- Bitcoin Price Could Fall to $50,000, Standard Chartered Says — Is a Crash Coming?
- Cardano Price Prediction Ahead of Midnight Mainnet Launch
- Pi Network Price Prediction as Mainnet Upgrade Deadline Nears on Feb 15
- XRP Price Outlook Amid XRP Community Day 2026


