LUNC Price Hints a 12% Jump this Week, But There’s a Catch


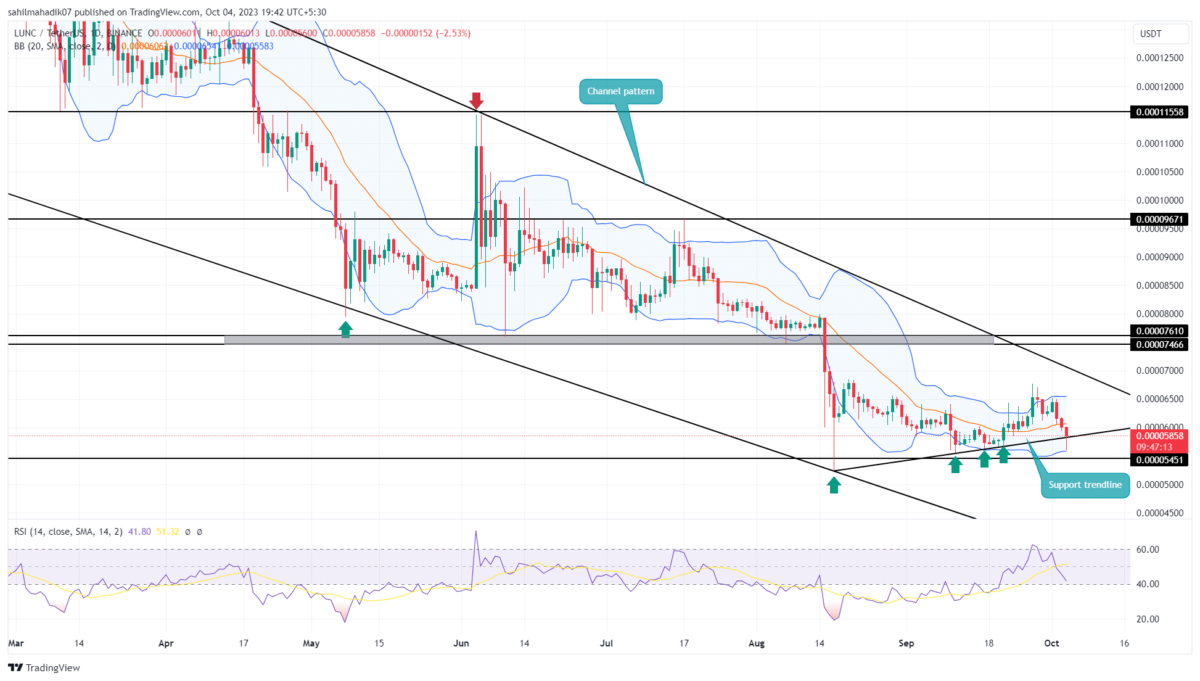
The predominant trend for Terra classic coin price over the last few months has been bearish, as evident from the series of lower highs and lower lows. The price has consistently been making downward moves, often finding resistance at the upper trendline of the established channel pattern. With the coin price reapproaching the pattern’s upper trendline, will traders witness a surge in selling pressure?
Also Read: Is This Bitcoin Rally A Trap? On-chain Analysis
Demand Pressure Hints Potential Upswing
- The coin buyers continue to witness demand pressure at a rising trendline
- A bullish breakout from the channel pattern could recuperate bullish momentum for a recovery
- The intraday trading volume in the LUNC coin is $20.5 Million, indicating an 8.6% gain.
 Source- Tradingview
Over the past 7 weeks, the LUNC price has traded majorly sideways, reflecting an uncertain sentiment among the market participants. However, despite this consolidation, a new emerging support trendline has cushioned buyers with dynamic support to lead a minor relief rally.
With the leading cryptocurrency, Bitcoin reverted from the $28500 mark the crypto market recently witnessed a noticeable turn. The LUNA price wasn’t spared, recording a weekly loss of 13.3%, bringing its current trading value down to $0.000058. Earlier today, with an intraday loss of 6%, the coin price tried to breach the support level of the ongoing relief rally.
However, this altcoin witnessed an immediate surge in buying pressure around the $0.000056 line, pushing the price higher with a long tail rejection candle in the daily time frame chart. This bullish reversal candle arrived at a strong support signal. The potential upswing could surge the price 12% higher to hit the upper trendline of the channel pattern around $0.000065.
Can LUNC Price Rise Back to $0.000075?
The Descending channels are generally bearish patterns but a breakout above the upper resistance can suggest a trend reversal. The multiple touchpoints at both the resistance and support trendlines highlight the strength and validity of this pattern. Therefore, the investors bullish on Terra classic coin should wait for a breakout above the upper trendline. Should this occur, the buyers can expect $0.000075 as an early target.
- Bollinger Band: An uptick in the lower band of the Bollinger band indicator can offer additional support to buyers.
- Relative Strength Index: The daily RSI above 40% could hint at suitable momentum for a bullish reversal.

Why Trust CoinGape
CoinGape has covered the cryptocurrency industry since 2017, aiming to provide informative insights Read more…to our readers. Our journal analysts bring years of experience in market analysis and blockchain technology to ensure factual accuracy and balanced reporting. By following our Editorial Policy, our writers verify every source, fact-check each story, rely on reputable sources, and attribute quotes and media correctly. We also follow a rigorous Review Methodology when evaluating exchanges and tools. From emerging blockchain projects and coin launches to industry events and technical developments, we cover all facets of the digital asset space with unwavering commitment to timely, relevant information.
Related Articles


- Breaking: FTX’s Sam Bankman-Fried (SBF) Seeks New Trial Amid Push For Trump’s Pardon
- Fed’s Hammack Says Rate Cuts May Stay on Hold Ahead of Jobs, CPI Data Release
- $800B Interactive Brokers Launches Bitcoin, Ethereum Futures via Coinbase Derivatives
- Michael Saylor Says Strategy Won’t Sell Bitcoin Despite Unrealized Loss, Will Keep Buying Every Quarter
- BlackRock Bitcoin ETF (IBIT) Options Data Signals Rising Interest in BTC Over Gold Now
- Bitcoin Price Analysis Ahead of US NFP Data, Inflation Report, White House Crypto Summit
- Ethereum Price Outlook As Vitalik Dumps ETH While Wall Street Accumulates
- XRP Price Prediction Ahead of White House Meeting That Could Fuel Clarity Act Hopes
- Cardano Price Prediction as Bitcoin Stuggles Around $70k
- Bitcoin Price at Risk of Falling to $60k as Goldman Sachs Issues Major Warning on US Stocks
- Pi Network Price Outlook Ahead of This Week’s 82M Token Unlock: What’s Next for Pi?


