LUNC Price to Hit $0.00009 High? Key Indicator Signals Reversal Sign at Support
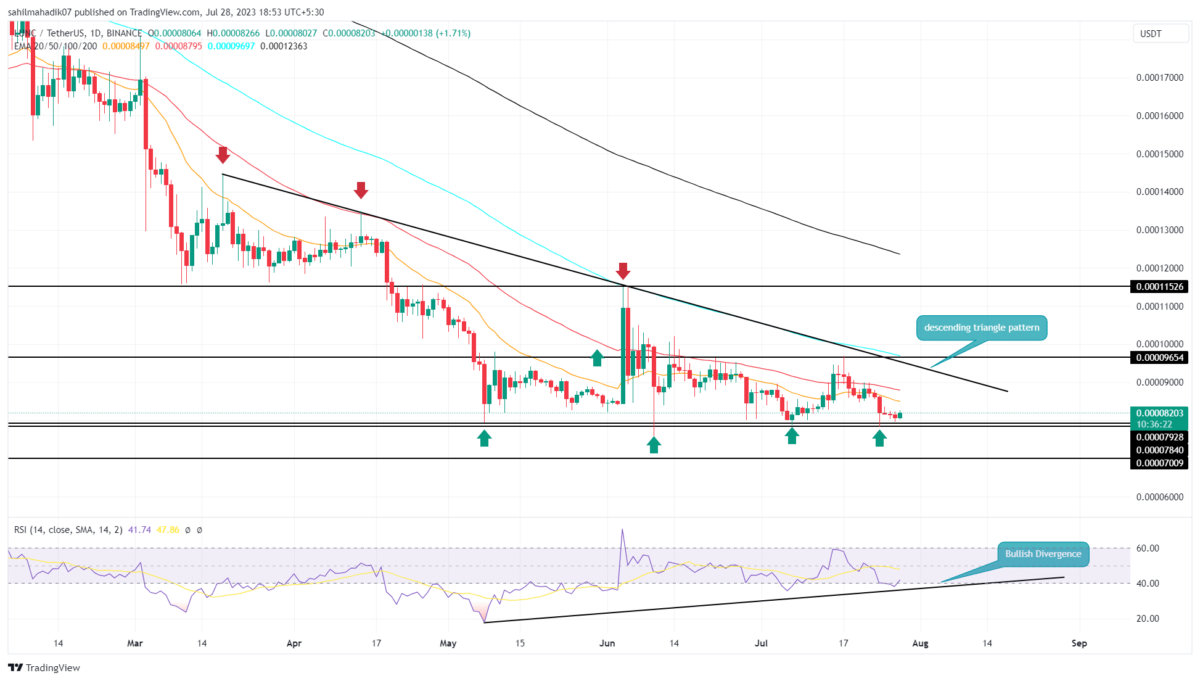
Over the past four months, a downsloping trendline has been constantly hammering the LUNC price with dynamic resistance. The daily chart shows three rejections from this trendline indicating the traders are actively selling at this level. Though the growing supply pressure tries to maintain an established downtrend, the buyers heavily protect horizontal support of $0.000079. The falling trendline and flat support resemble the formation of a bearish continuation pattern called a descending triangle. Here’s how this pattern could influence the future price of Terra classic coins.
Also Read: Terra Luna Classic L1TF Announces Partnership For Station And Finder Development
LUNC Price Daily Chart
- A potential reversal from $0.000079 sets the LUNC price for a 10% jump.
- The market participants witnessed demand pressure at the $0.000079 mark
- The intraday trading volume in the LUNC coin is $22.4 Million, indicating a 12% gain.
With the increased bearishness in the crypto market. the LUNC price has been in a correction phase for the past two weeks. From the $0.0000968 high the coin price tumbled 15% to reach the current trading price of $0.0000822.
With an intraday gain of 1.92%, the coin price hovers above the bottom support of $0.000079. The coin price rebounded several times from this support indicating a strong accumulation zone for investors.
Therefore until this support is intact, the LUNC price may continue to resonate in a sideways trend. The potential reversal could surge the prices by 10% and rechallenges the overhead trendline near $0.00009.
Will Terra Classic Price Correction Reach $0.00007?
In theory, the descending triangle pattern is known as the downtrend continuation pattern which intensifies the market selling pressure upon the breakdown of its $0.000079 neckline. Therefore, a breakdown below $0.000079 will offer buyers an additional barrier to pressure the coin price to a lower level. The post-breakdown fall could plummet the price back to the $0.00007 mark.
- Exponential Moving Average: The 100-day EMA acts as a dynamic resistance against buyers.
- Relative Strength Index: An evident rise in the daily RSI slope indicates bullish divergence and a high possibility of an upside breakout.
Recent Posts
- Price Analysis
XRP Price Prediction: Will 4 Billion Transactions Spark Next Rally?
XRP price trades below the $2 mark after the latest correction across the broader cryptocurrency…
- Price Analysis
Solana Price Outlook: Will SOL Recover With Strong Institutional Buying?
Solana price remains steady above the $120 support after the recent crypto market pullback. The…
- Price Analysis
Ethereum Price Risks Crash to $2,500 Amid Sustained Wintermute Dumping
Ethereum price dropped below the key support at $3,000 on Tuesday, down by ~40% from…
- Price Analysis
Is It Time to Sell Bitcoin for Gold- Analyst Spots 2023 Pattern That Triggered BTC’s Last Major Rally
The Stock Market rose modestly as crypto market consolidation sparked a fresh Bitcoin vs Gold…
- Price Analysis
Bitcoin Price Prediction and Analysis: Will BTC Hit $100k Before Year-End?
Bitcoin price moves into the final trading sessions with uncertainty around upside continuation. BTC price…
- Price Analysis
Bitcoin Price Prediction As Michael Saylor Pauses BTC Purchase- Is A Fall to $74k Imminent?
Michael Saylor's Strategy has paused additional BTC purchases while increasing cash reserves, prompting renewed speculation…