LUNC Price Gearing Up for a Major Breakout; $0.0001 Within Reach?

For over a week, the LUNC coin price has been hovering above the multi-month support of $0.00000792 and $0.00000784. Amid the increasing selling pressure in the crypto market, buyers are struggling to rebound to higher levels indicating a weakness in bullish momentum. Will this consolidation trigger a new recovery cycle or set the altcoin for an extended downtrend?
Also Read: Professor Edward Kim Transfers Admin Access To Terra Luna Classic L1TF
LUNC Price Daily Chart
- The descending triangle pattern carries the current sideways action in the LUNC price
- The bullish breakout from the overhead trendline set the LUNC price for a 10% upswing.
- The intraday trading volume in the LUNC coin is $24.9 Million, indicating a 21% gain.

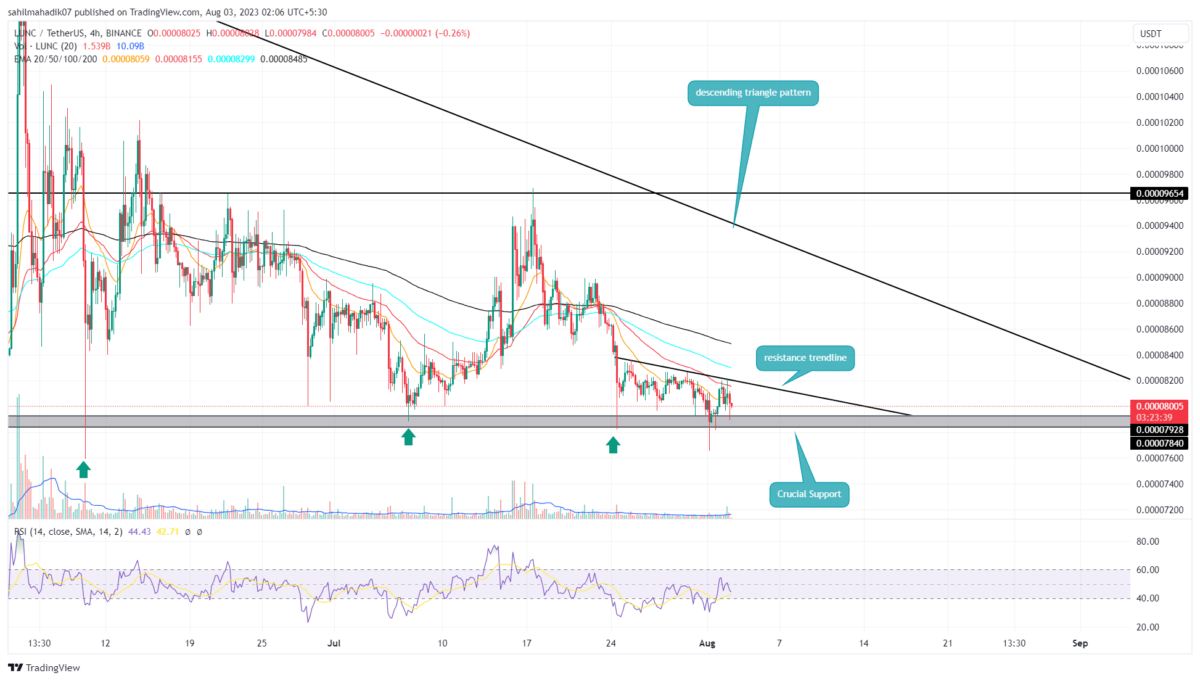
Amid the ongoing consolidation in LUNC price showcased multiple daily candles with short-bodies and long wicks indicating uncertainty among traders. However, this sideways is getting squeezed within a downsloping trendline and $0.0000792 support.
The 4-hour time frame chart shows the coin price reverted at least thrice from the overhead trendline indicating sellers are aggressive at this dynamic resistance. By the press time, the Terra classic coin price trades at $0.00008, and with an intraday loss of 1.35%, it’s heading back to bottom support.
However, the narrowing range indicates this altcoin is poised for a significant breakout. A bullish breakout from the overhead trendline will boast the market buying pressure and surge the LUNC price 10% up to hit the long-coming downsloping trendline of the triangle pattern.
Will LUNC Price Heading to $0.0001?
The daily time frame chart shows the LUNC price resonating within a descending triangle pattern. The anticipated reversal from $0.00000782 support will trigger an upswing within the boundaries of this pattern. Until the resistance trendline of this pattern is intact the coin holders can expect a sideways trend in action. Therefore, the coin price would need a breakout above the downsloping trendline before hitting $0.0001.
- Exponential Moving Average: The 100-day EMA dynamic resistance assists the triangle pattern to prolong the sideways trend.
- Relative Strength Index: The rising RSI slope indicates the bullish momentum is rising near the $0.00000784 support.
- XRP Community Day: Ripple CEO on XRP as the ‘North Star,’ CLARITY Act and Trillion-Dollar Crypto Company
- Denmark’s Danske Bank Reverses 8-Year Crypto Ban, Opens Doors to Bitcoin and Ethereum ETPs
- Breaking: $14T BlackRock To Venture Into DeFi On Uniswap, UNI Token Surges 28%
- U.S. Jobs Report: January Nonfarm Payrolls Rise To 130k, Bitcoin Falls
- Arkham Exchange Shut Down Rumors Denied as Bear Market Jitters Deepen
- Ethereum Price at Risk of a 30% Crash as Futures Open Interest Dive During the Crypto Winter
- Ethereum Price Prediction Ahead of Roadmap Upgrades and Hegota Launch
- BTC Price Prediction Ahead of US Jobs Report, CPI Data and U.S. Government Shutdown
- Ripple Price Prediction As Goldman Sachs Discloses Crypto Exposure Including XRP
- Bitcoin Price Analysis Ahead of US NFP Data, Inflation Report, White House Crypto Summit
- Ethereum Price Outlook As Vitalik Dumps ETH While Wall Street Accumulates


