MATIC Price Analysis: Bear Trap Sets $MATIC Price for 12% Upswing
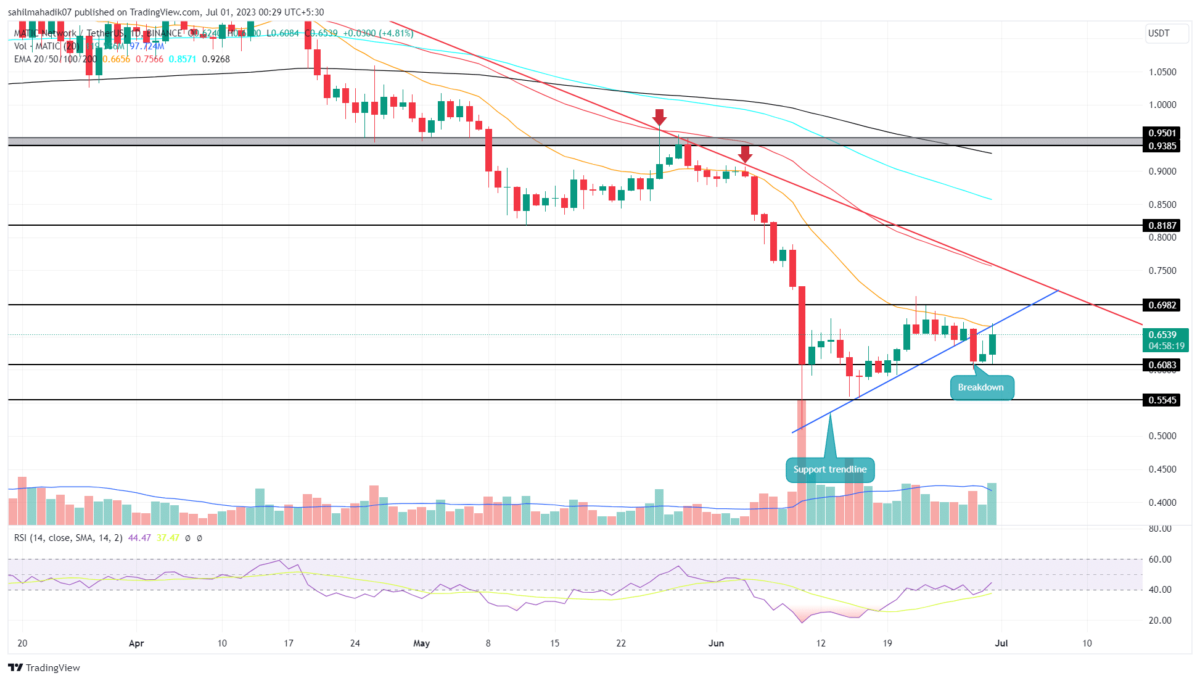
MATIC Price Analysis: On June 28th, the MATIC price breached an ascending support trendline which carried a relief rally for the past three weeks. The decisive breakdown in the daily chart was supposed to accelerate selling pressure and prolong the downward trend. However, the prices showed no follow-up to this breakdown indicating weakness in the sellers’ commitment and the buyer’s aggressiveness in lifting the prices higher. But how far may this recovery go?
Also Read: Polygon 2.0 Architecture Unveiled, MATIC Price Surges by 5.6%
MATIC Price Daily Chart
- A downsloping trendline(red) has carried a downtrend for the last four months.
- A fake breakdown from the support trendline(blue) may intensify the bullish momentum in the Polygon coin.
- The intraday trading volume in the MATIC is $443.5 Million, indicating a 59.5% gain.
Despite a breakdown of a significant support trendline, the MATIC price bounced back from the $0.6 support, with a formation bullish reversal candle pattern called the morning star. This candle development undermines the seller’s attempt to take the price lower and reflects the buyers’ strength to regain a higher price.
By the press time, the MATIC price trades at $0.65 with an intraday gain of 4.57%. With sustained, the buyers may reclaim the rising trendline which would mark the prior breakdown as a bear trap.
If the coin continues its upward rally, the short-sellers trapped with this breakdown would exit their position with buy orders and further accelerate the bullish momentum.
Thus, the resumed recovery may show 12% growth before it hits the next significant resistance of $0.7.
Will MATIC Price Surpass the $0.7 Mark?
If the bullish momentum rises, the polygon coin is likely to rise higher and reach the local resistance of $0.7. However, this horizontal resistance combined with a downsloping trendline creates a confluence barrier that triggers high supply pressure. If the coin chart started projecting rejection signs at this barrier the sellers may prolong the downward trend.
- Exponential Moving Average: The 20-and-50-day EMA slope offers dynamic resistance against rising prices.
- Relative strength index: despite the recent breakdown, the daily RSI slope also surged above the 40% mark accentuating the bullish sentiment is intact.
Recent Posts
- Price Analysis
Will Solana Price Hit $150 as Mangocueticals Partners With Cube Group on $100M SOL Treasury?
Solana price remains a focal point as it responds to both institutional alignment and shifting…
- Price Analysis
SUI Price Forecast After Bitwise Filed for SUI ETF With U.S. SEC – Is $3 Next?
SUI price remains positioned at a critical intersection of regulatory positioning and technical structure. Recent…
- Price Analysis
Bitcoin Price Alarming Pattern Points to a Dip to $80k as $2.7b Options Expires Today
Bitcoin price rebounded by 3% today, Dec. 19, reaching a high of $87,960. This rise…
- Price Analysis
Dogecoin Price Prediction Points to $0.20 Rebound as Coinbase Launches Regulated DOGE Futures
Dogecoin price has gone back to the spotlight as it responds to the growing derivatives…
- Price Analysis
Pi Coin Price Prediction as Expert Warns Bitcoin May Hit $70k After BoJ Rate Hike
Pi Coin price rose by 1.05% today, Dec. 18, mirroring the performance of Bitcoin and…
- Price Analysis
Cardano Price Outlook: Will the NIGHT Token Demand Surge Trigger a Rebound?
Cardano price has entered a decisive phase as NIGHT token liquidity rotation intersects with structural…