MATIC Price Analysis: Can $0.5 Support Halt the Downward Spiral?
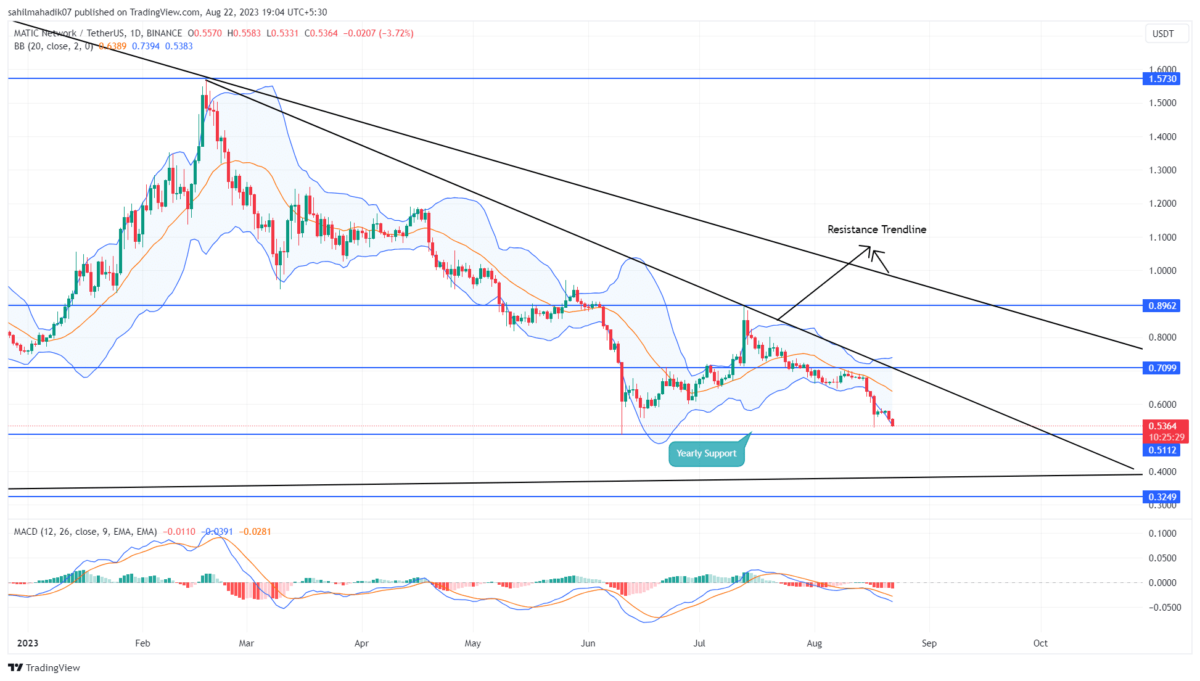
The MATIC price correction trend formed a new lower high at $0.891 and tumbled aggressively in the last five weeks. This downfall registered a 40% loss and evaporated the entire gain accumulated in the June-July rally. The falling prices may soon hit June 2022 at $0.509 to find suitable support. Can yearly support recuperate enough bullish momentum to kickstart a new recovery
Also Read: MATIC Price Heading to $0.5 Support; Buy this Dip?
MATIC Daily Chart: Key Points
- A bearish breakdown below $0.509 could extend the correction trend to $0.4 psychological support
- An ascending trendline wavering near the $0.4 mark has remained intact for over two years and therefore could offer a high area of interest for a potential bullish reversal.
- The intraday trading volume of the MATIC coin is $292 Million, showing a 15% gain.
The polygon coin shows an evident V-top reversal from the $0.89. This downfall associated with rising volume indicates the sellers are aggressive and will lead to a prolonged correction in the near future.
Despite a significant price drop on August 17th triggered by broader market sentiment, the MATIC price continued a downward march, accentuating the active selling momentum. By the press time, this thirteenth largest cryptocurrency trades at $0.538, with an intraday loss of 3.34%
If the selling sentiment persists, the polygon coin could give a breakdown below the $0.509 support, The post breakdown may tumble the prices by 25% and hit a long-coming support trendline.
[converter id=”matic-polygon” url=”https://coingape.com/price/converter/polygon-to-usd/?amount=1″]
Can Polygon Coin Recovery Back to $0.9?
While the MATIC price behavior reflects the continuation of a downward trend, the coin buyers can obtain a long opportunity after a breakout of the overhead trendline. This resistance trendline is currently carrying the correction, and therefore its breakout could assist buyers to rechallenge the $0.07 or $0.9 barrier
- Bollinger Band: The downtick in the lower band on the Bollinger band indicator reflects the selling momentum is still aggressive.
- Moving Average Convergence Divergence: A bearish alignment between the MACD(blue) and signal(orange) project a downtrend sentiment.
Recent Posts
- Price Analysis
Ethereum Price Prediction 2026 As Vitalik Buterin Unveils New Scaling Roadmap
Ethereum price as the year 2026 begins has rallied past $3,100, marking a strong recovery.…
- Price Analysis
Bitcoin Price and XRP Price Prediction 2026 Ahead of US Crypto Reserve, CLARITY Act
Bitcoin price and XRP price enter 2026 trading within compression structures that reflect balance rather…
- Price Analysis
Analyst Predicts Cardano Price to Surge 103% to $0.75 as Midnight, Leios Launch Near
Cardano price started the year well, rising for the initial two days. ADA rose by…
- Price Analysis
Dogecoin Price Jumps 10% as Whales Scoop Up 220M DOGE; What’s Next?
Dogecoin price soared 10% within the last 24 hours as whale wallets accumulated more than…
- Price Analysis
Here’s Why Crypto Market Turns Bullish as 2026 Kicks Off
The crypto market began 2026 with bullish momentum after weeks of cautious trading in late…
- Price Analysis
Pepe Coin price Enters 2026 with a 25% Surge as Open Interest Jumps 82% — What’s Next?
PEPE Coin price enters the new year with visible strength after surging over 25%, as…