MATIC Price Analysis: Will $MATIC Price Reclaim $1 in July?
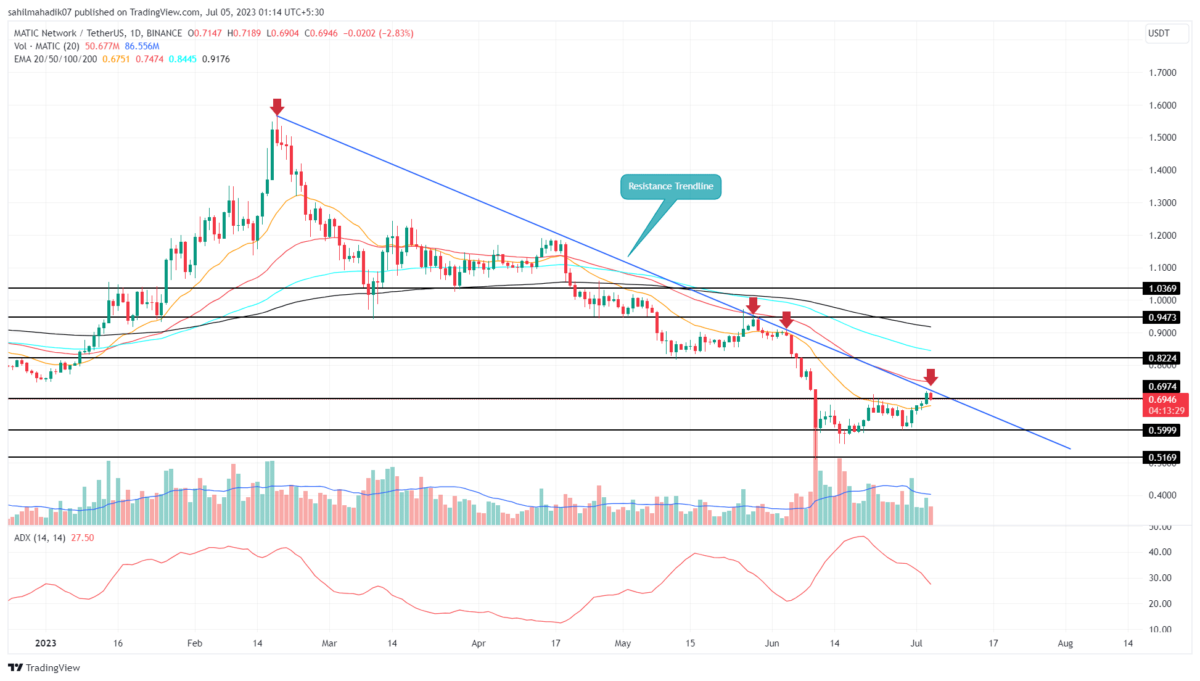
MATIC Price Analysis: Over the past three weeks, the MATIC price has shown a silent recovery in the daily time frame chart. From the June low of $0.5089, the coin price surged 40% to reach this month’s high near $0.72. Amid this breakout, the coin price showed a bullish breakout from the $0.694 horizontal resistance, which should boost the buying pressure in the market. However, with a suitable follow and overhead supply pressure from the downsloping trendline, this breakout may fail to trigger a steeper fall.
Also Read: Polygon 2.0 Architecture Unveiled, MATIC Price Surges by 5.6%
MATIC Price Daily Chart
- A potential reversal from the resistance trendline sets the MATIC price for a potential fall of 13.7%
- A fake breakout from the $0.694 resistance may accelerate selling pressure among traders
- The intraday trading volume in the MATIC is $289.5 Million, indicating a 15.5% loss.
With an intraday loss of 2.85%, the MATIC price turned down from a downsloping resistance trendline. Over the past four months, the price has revered thrice from this dynamic resistance, indicating the traders have been actively selling bullish bounces which is a key trait of a sustained downtrend.
Therefore, a reversal from this trendline can be an early sign of significant downfall. Currently, the Polygon coin trades at $0.693 and has plunged below the recently reclaimed support of $0.694.
If the falling price closes below the $0.678 low of yesterday’s candle, the buyers’ weapon to trade will break and sellers will have higher command over the trend. The potential downfall could tumble the prices 13.7% lower to hit the $0.6 psychological barrier.
Will MATIC Price Reach to $1 Mark?
For buyers to regain trend control, it needs to breach the long-coming resistance trendline. As per the dow theory of the financial market, no trade remains the same, and therefore, the aforementioned breakout will be the first signal of a trend change. The buyers could drive a post-breakout rally to $0.822, followed by $0.947 and $1.036.
- Average Directional Movement Index: The falling ADX slope also reflects the weakening of bearish momentum.
- Exponential Moving Average: IF the falling prices breached the 20-day EMA slope the short-sellers will gain an extra edge.
Recent Posts
- Price Analysis
Binance Coin Price Risks Crash to $700 as Key BSC Metric Plunges 80%
Binance Coin price dropped by over 1% today, Dec. 29, as the crypto market remained…
- Price Analysis
SUI Price Forecast: What’s Next for SUI in 2026 After $78.9M Token Unlocks?
SUI price has spent recent sessions consolidating within a narrow range. The action reflect controlled…
- Price Analysis
Solana Price Prediction: How High Could SOL Go in January 2026?
Solana price showed signs of strength in early January 2026, hovering near $127 after a…
- Price Analysis
Top 3 Predictions for Bitcoin price, Ethereum price and XRP price for 2026 According to Analysts
Bitcoin price, Ethereum price, and XRP price show renewed strength heading into 2026 after daily…
- Price Analysis
Is $1 Dogecoin Price Technically Possible in 2026?
As the years draw to a close, Dogecoin trades above $0.12 amid a broader crypto…
- Price Analysis
Bitcoin Price Year-End Prediction: Analysts Highlight Key Levels Before 2025 Close
Bitcoin price hovered at $87,755 on December 28, 2025, as the year came to an…