MATIC Price Analysis: Will $MATIC Price Recovery Rally Hit $1 in July?
MATIC Price Analysis: The ongoing recovery rally in MATIC price projects an early sign of trend reversal as buyer’s breach a multi-month resistance trendline. For nearly five months, the coin price witnessed active selling at this trendline carrying an established downtrend, however, with the recent recovery in the crypto market, the buyers gave a massive breakout from this trendline suggesting a start of a fresh bull rally.
Also Read: What’s Driving Polygon (MATIC) Price Rally In July 2023?
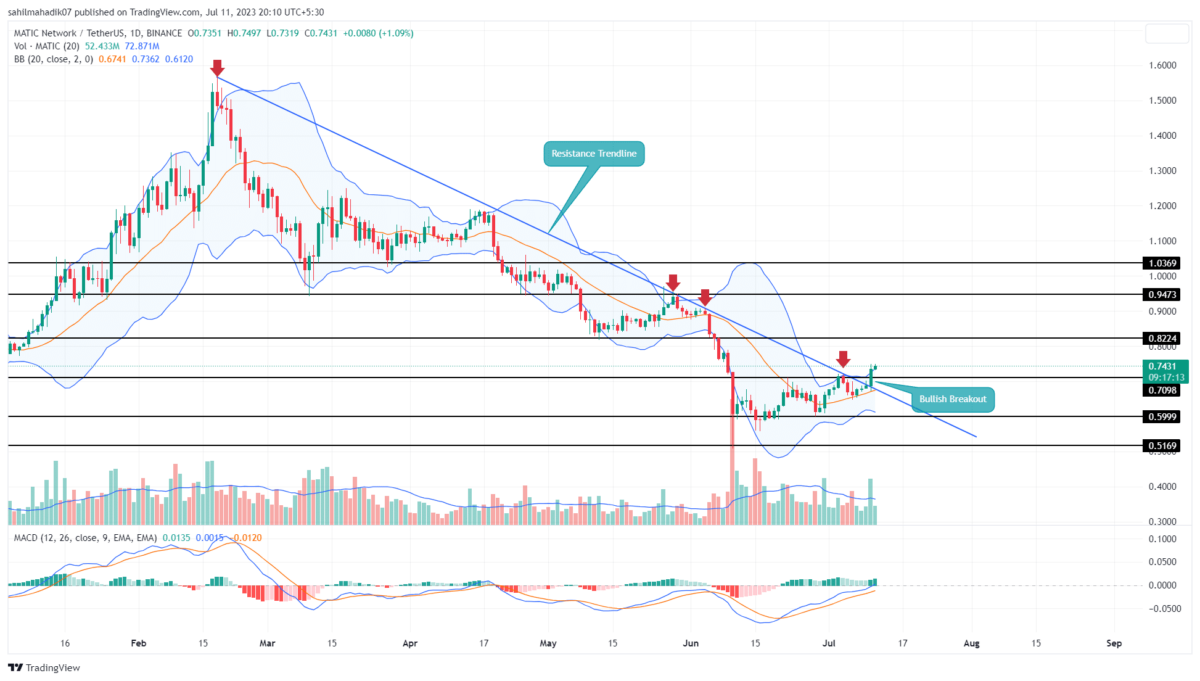
MATIC Price Daily Chart:
- High momentum breakout from resistance trendline set polygon coin for a 27.5% bullish upswing
- The coin price could show a minor pullback to retest the breached trendline before the next leap
- The intraday trading volume of the Polygon coin is $499.6 Million, showing a 63% gain.
On July 10th, the MATIC recovery rally gave a decisive breakout from the long-coming resistance trendline. This breakout backed by increased volume reflects the buyer’s conviction to reclaim higher grounds.
With a 1.2% intraday gain, altcoin offered a suitable follow-up to prolong the bullish rally. However, a minor pullback is possible to check the potential support strength of the reclaimed trendline.
[converter id=”matic-polygon” url=”https://coingape.com/price/converter/polygon-to-usd/?amount=1″]
This trendline may act as a point for building long positions and a solid springboard to bolster buyers. By the press time, the Polygon coin price was trading at $0.74, and with steady it could be next to significant resistance of $0.822, followed by $0.947, and $1.03.
Can Polygon Price Go Back To $0.6?
If the broader market sentiment remains indecisive, the buyers struggle to sustain above the breached trendline. On a pessimistic approach, a breakdown below the trendline with a daily candle closing, will offset the bullish thesis and project the continuation of a bearish trend. This breakdown will create a fake breakout scenario, and plunge the coin price back to $0.6.
- Bollinger Band: The upper band of the Bollinger band indicator challenged on the upside reflects strong bullish momentum.
- Moving Average Convergence Divergence: A steady growth in MACD(blue) and signal(orange) line showcase uptrend sentiment among traders.
Recent Posts
- Price Analysis
Shiba Inu Price Prediction: Will SHIB Show Golden Cross Signal in 2026?
Discussion around a potential Golden Cross in 2026 has intensified as Shina Inu price compresses…
- Price Analysis
Pi Network Price Prediction as Demand Slips Ahead of the 136m Unlock
Pi Network price is stuck in a bear market this month, and odds are high…
- Price Analysis
Why Bitcoin, Ethereum, XRP, and ADA Prices Are Falling Today
Over the past 24 hours, Bitcoin, Ethereum, XRP, and ADA prices dropped as the broader…
- Price Analysis
Is XRP Price Preparing for Trend Reversal as ETF Inflows Extend to a 7th Straight Week?
The XRP price is in a consolidation stage following months of continuous declining pressure. The…
- Price Analysis
Binance Coin Price Risks Crash to $700 as Key BSC Metric Plunges 80%
Binance Coin price dropped by over 1% today, Dec. 29, as the crypto market remained…
- Price Analysis
SUI Price Forecast: What’s Next for SUI in 2026 After $78.9M Token Unlocks?
SUI price has spent recent sessions consolidating within a narrow range. The action reflect controlled…