MATIC Price Analysis: Will the Ongoing Correction Extend to $0.6?


MATIC Price Analysis: The daily time frame chart of MATIC price shows a V-top reversal from the $0.89 mark. A bearish reversal of this type reflects aggressive momentum which leads to significant downfall in a short period. Within a month, the 11th largest cryptocurrency tumbled 27% and reached local support of $0.64. Will this correction extend in the coming weeks?
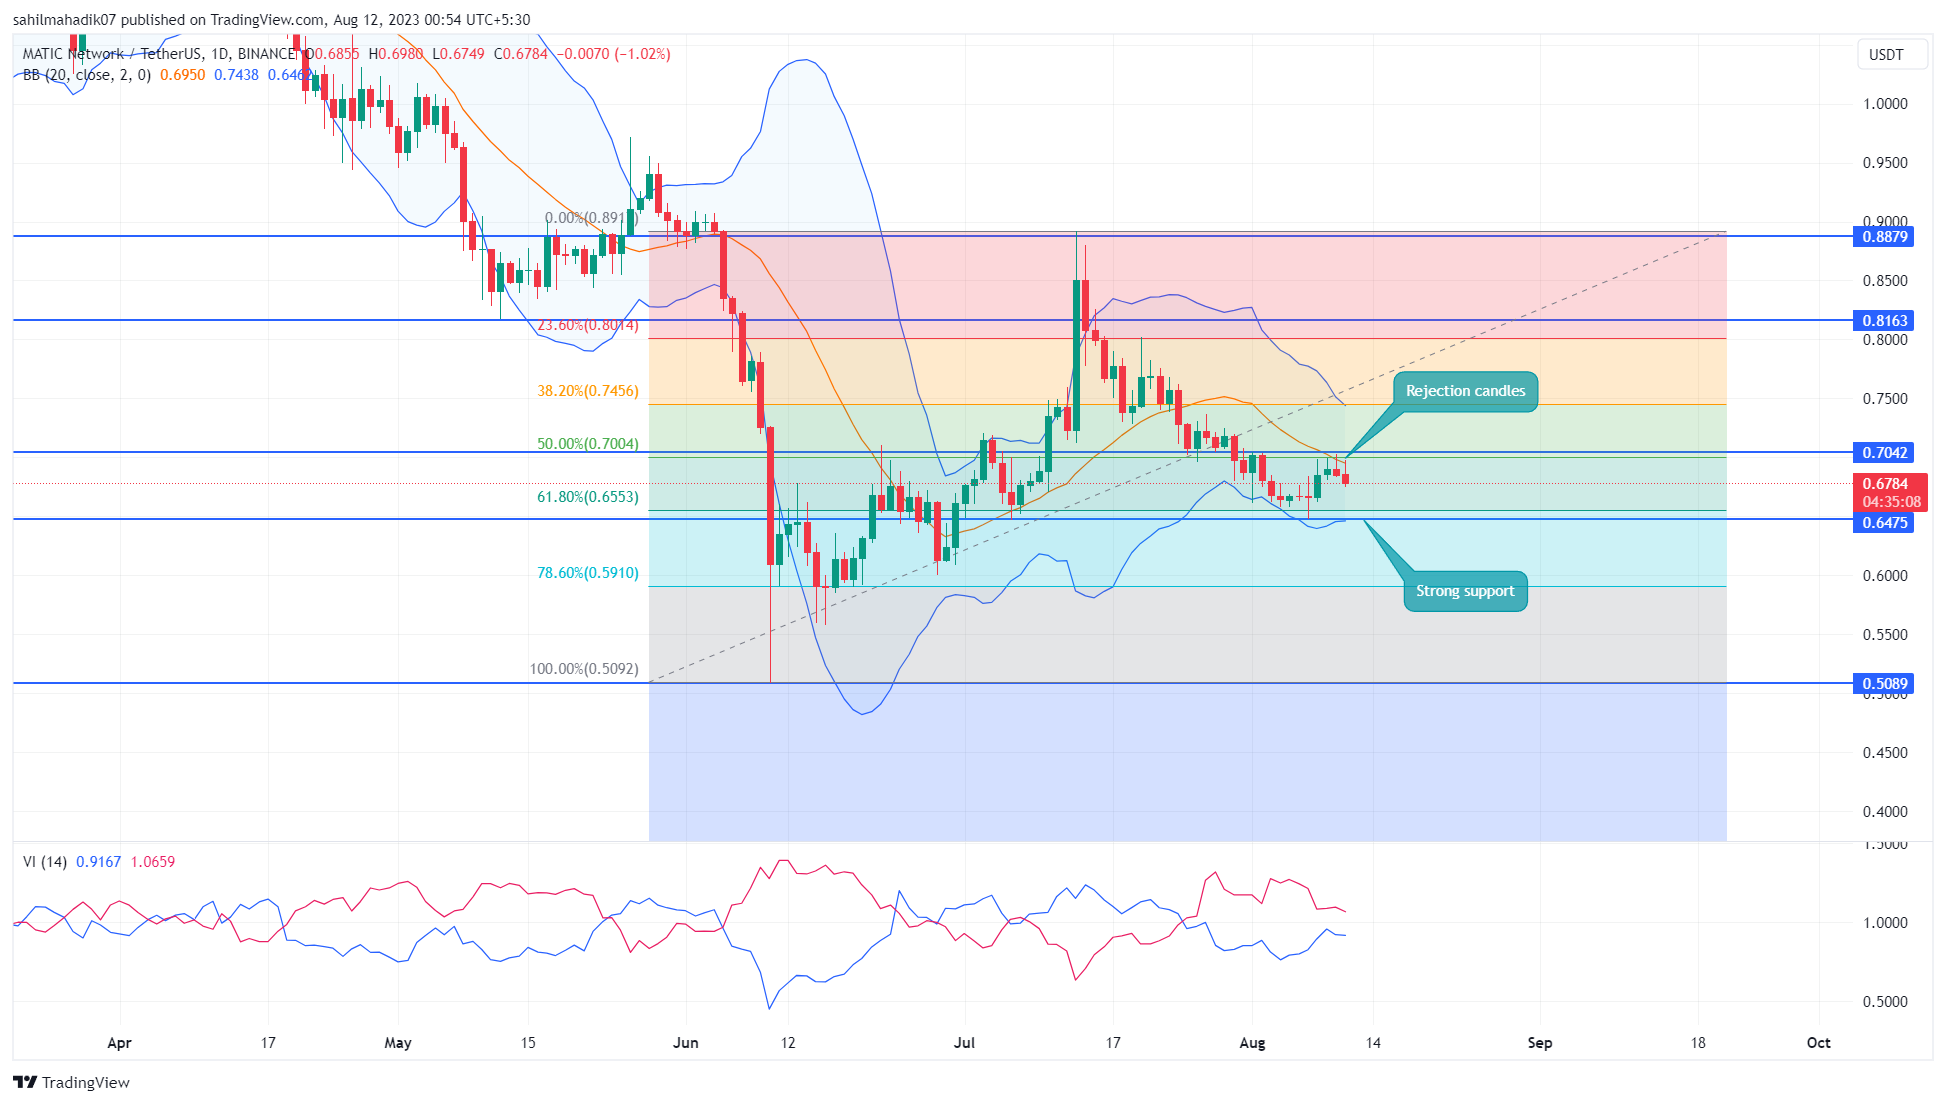
MATIC Price Daily Chart:
- A bearish breakdown below $0.647 plunges the market price by 7.5%
- Multiple high wick rejection candles at the $0.7 reflect intense overhead supply
- The intraday trading volume of the MATIC coin is $195.2 Million, showing a 27% loss.
 Source- Tradingview
The falling polygon coin price found suitable support at $0.6475 aligned with the 61.8% Fibonacci retracement level. However, a correction to this low FIB level indicates some weakness in bullish momentum and therefore the traders must remain cautious.
On August 7th, the coin price rebounded from $0.647 support but the prices could not sustain about the overhead resistance of $0.7. In the last four days, the altcoin shows higher price rejection at the aforementioned barrier indicating the overhead supply pressure is aggressive.
These signs of rejection reflect the MATIC sellers could rechallenge the $0.647 support for a bearish breakdown. If the coin price breaks the below-mentioned support with a daily candle close, the sellers may prolong the correction phase by another 7.5% to reach the psychological support of $0.6.
[converter id=”matic-polygon” url=”https://coingape.com/price/converter/polygon-to-usd/?amount=1″]
Can Polygon Price Plunge Back to $0.6?
If the Matic price shows sustainability about the $0.647 support, it would indicate the buyers are actively accumulating at discounted prices. The coin holders must closely watch this support as a potential reversal could also create a new higher low in the daily chart which is an early sign of trend reversal. Furthermore, a bullish breakout from the immediate resistance of $0.7 would bolster buyers with a rally to revisit $0.8
- Bollinger band: An upswing in the lower band of the Bollinger band indicator could offer additional support at $0.647
- Vortex Indicator: A bearish crossover state between the VI+(blue) and VI-(orange) slope reflects the prevailing bearish momentum is intact.
Why Trust CoinGape
CoinGape has covered the cryptocurrency industry since 2017, aiming to provide informative insights Read more…to our readers. Our journal analysts bring years of experience in market analysis and blockchain technology to ensure factual accuracy and balanced reporting. By following our Editorial Policy, our writers verify every source, fact-check each story, rely on reputable sources, and attribute quotes and media correctly. We also follow a rigorous Review Methodology when evaluating exchanges and tools. From emerging blockchain projects and coin launches to industry events and technical developments, we cover all facets of the digital asset space with unwavering commitment to timely, relevant information.
Related Articles


- SEC, CFTC to Sign MoU on Crypto Oversight in Bid to Make America the Crypto Capital
- Trump To Name Next Fed Chair Next Week as Pro-Crypto Chris Waller Gains Momentum
- BTC Price Crashes Below $85K Amid U.S.-Iran Tensions and Hawkish Fed Pivot
- Breaking: CLARITY Act Advances as Senate Ag. Committee Votes In Favor Of Crypto Bill
- NOWPayments Review 2026 : Features, Fees & Is It Worth It?
- Ethereum and XRP Price Prediction as Odds of Trump Attack on Iran Rise
- Gold and S&P 500 Price Prediction as BTC $88K Sparks Global Risk-On Rally
- How High Can Hyperliquid Price Go in Feb 2026?
- Top Meme Coins Price Prediction: Dogecoin, Shiba Inu, Pepe, and Pump. Fun as Crypto Market Recovers.
- Solana Price Targets $200 as $152B WisdomTree Joins the Ecosystem
- XRP Price Prediction After Ripple Treasury launch


