MATIC Price Analysis: Will the Ongoing Correction Extend to $0.6?
MATIC Price Analysis: The daily time frame chart of MATIC price shows a V-top reversal from the $0.89 mark. A bearish reversal of this type reflects aggressive momentum which leads to significant downfall in a short period. Within a month, the 11th largest cryptocurrency tumbled 27% and reached local support of $0.64. Will this correction extend in the coming weeks?
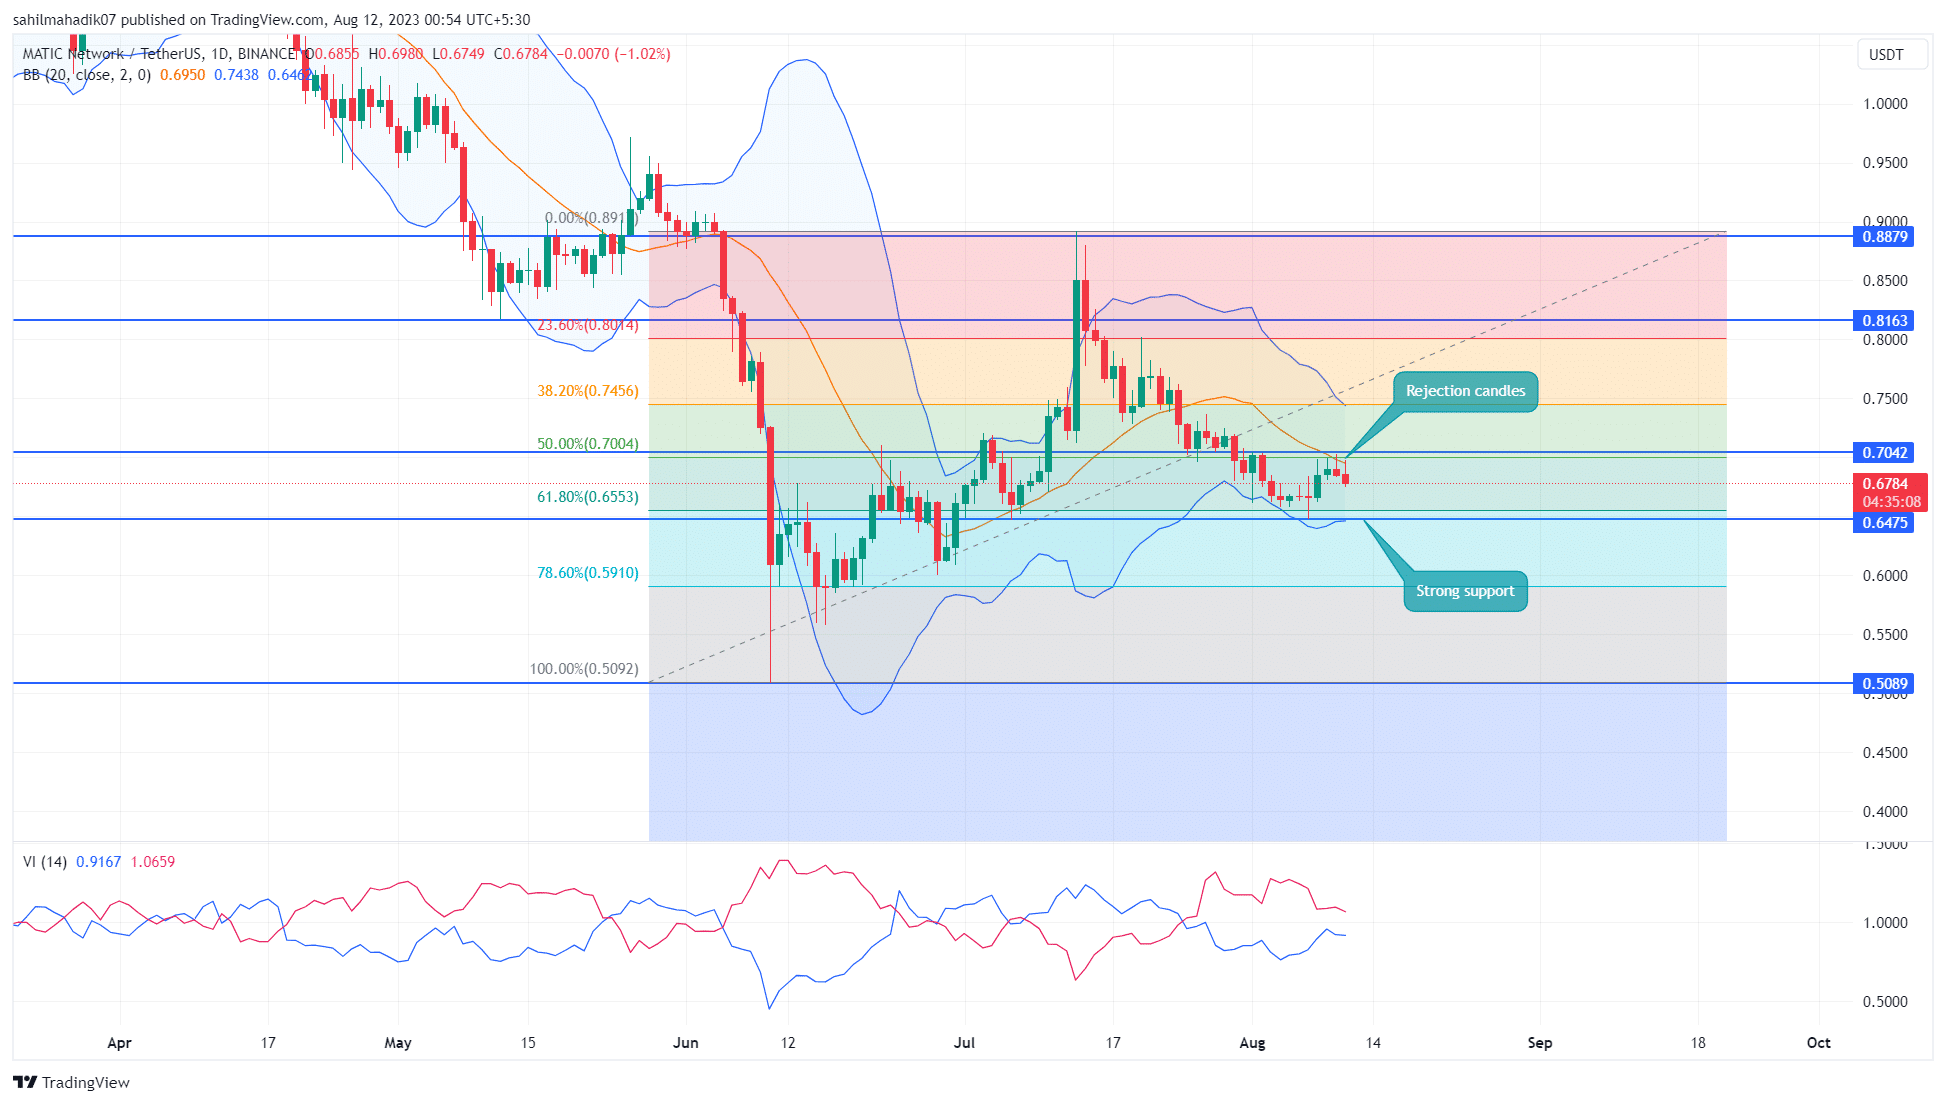
MATIC Price Daily Chart:
- A bearish breakdown below $0.647 plunges the market price by 7.5%
- Multiple high wick rejection candles at the $0.7 reflect intense overhead supply
- The intraday trading volume of the MATIC coin is $195.2 Million, showing a 27% loss.
The falling polygon coin price found suitable support at $0.6475 aligned with the 61.8% Fibonacci retracement level. However, a correction to this low FIB level indicates some weakness in bullish momentum and therefore the traders must remain cautious.
On August 7th, the coin price rebounded from $0.647 support but the prices could not sustain about the overhead resistance of $0.7. In the last four days, the altcoin shows higher price rejection at the aforementioned barrier indicating the overhead supply pressure is aggressive.
These signs of rejection reflect the MATIC sellers could rechallenge the $0.647 support for a bearish breakdown. If the coin price breaks the below-mentioned support with a daily candle close, the sellers may prolong the correction phase by another 7.5% to reach the psychological support of $0.6.
[converter id=”matic-polygon” url=”https://coingape.com/price/converter/polygon-to-usd/?amount=1″]
Can Polygon Price Plunge Back to $0.6?
If the Matic price shows sustainability about the $0.647 support, it would indicate the buyers are actively accumulating at discounted prices. The coin holders must closely watch this support as a potential reversal could also create a new higher low in the daily chart which is an early sign of trend reversal. Furthermore, a bullish breakout from the immediate resistance of $0.7 would bolster buyers with a rally to revisit $0.8
- Bollinger band: An upswing in the lower band of the Bollinger band indicator could offer additional support at $0.647
- Vortex Indicator: A bearish crossover state between the VI+(blue) and VI-(orange) slope reflects the prevailing bearish momentum is intact.
Recent Posts
- Price Analysis
Weekly Crypto Price Prediction: Bitcoin, Ethereum and XRP
Bitcoin, Ethereum, and XRP prices are rallying following a sharp increase in overall market momentum. …
- Price Analysis
MSTR Stock Price Prediction 2026: Wall Street Senior Analyst Targets $500
MSTR stock price has dropped nearly 66% over the past six months, falling from above…
- Price Analysis
XRP Price Reclaims $2 After 10% Breakout: How High Can It Climb in January 2026?
XRP price jumped 10% in the last 24 hours, reclaiming the $2 level as bullish…
- Price Analysis
Ethereum Price Prediction 2026 As Vitalik Buterin Unveils New Scaling Roadmap
Ethereum price as the year 2026 begins has rallied past $3,100, marking a strong recovery.…
- Price Analysis
Bitcoin and XRP Price Prediction 2026 Ahead of US Crypto Reserve, CLARITY Act
Bitcoin price and XRP price enter 2026 trading within compression structures that reflect balance rather…
- Price Analysis
Analyst Predicts Cardano Price to Surge 103% to $0.75 as Midnight, Leios Launch Near
Cardano price started the year well, rising for the initial two days. ADA rose by…