MATIC Price Breaks Out of 3-Month Bullish Pattern Hints 40% rally Ahead


Amid the ongoing sell-off in the crypto market, the MATIC price turned down from $1.53-$1.5 resistance and witnessed a minor correction phase. The coin price has been falling for five consecutive days and has recorded an 11.3% loss to reach the $1.36 mark. However, this downfall is a retest phase to the recently completed rounding bottom pattern after the $1.31 resistance breakout.
Key Points
- The core concept behind the rounding bottom pattern is that it represents a gradual shift in investor sentiment from bearish to bullish.
- The parabolic growth in MATIC price backed by increasing volume indicates sustained recovery
- The intraday trading volume in the MATIC is $735.2 Million, indicating a 37.5% gain.
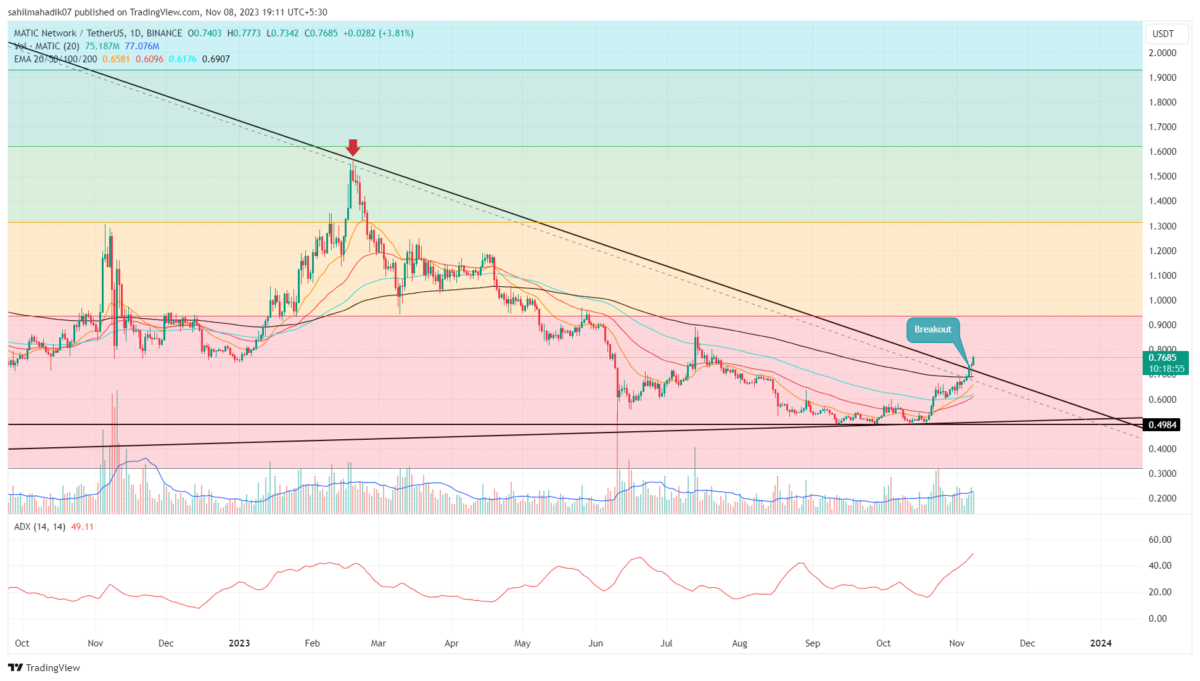
 Source- -Tradingview
The last three months’ price action of MATIC coin showcased the formation of a rounding bottom pattern. The pattern is formed when a coin price gradually falls to a low point, then begins to rise in a steady, rounded pattern. This gradual rise can continue until the price reaches a level that is equal to or higher than the starting point of the pattern.
On February 15th, the MATIC price gave a bullish breakout from the $1.31 neckline resistance of this pattern, indicating the buyers’ confidence in reaching a higher level. However, as mentioned the altcoin formed a local top at $1.53 and reverted to retest the breached resistance.
Also Read: CRYPTO TELEGRAM CHANNELS LIST 2023
This downfall backed by low-volume acting indicates the correction phase is temporary. If the coin price shows sustainability above $1.33-$1.31 the interest traders can look for an entry opportunity.
The post-retest rally could drive the polygon coin price 40% higher to hit the $1.88 mark.
On a contrary note, this potential bullish rally may face in-between resistances at $1.53-1.5, and $1.74-1.7.
Technical Indicators
RSI: despite rising price action, the daily RSI slope moving sideways indicates weakness in bullish momentum. Thus, this bearish divergence indicates the MATIC price could witness strong pullbacks moving ahead.
EMAs: The 20-day EMA has proven to offer strong support during the occasional pullback, and thus the traders can use it for trailing stop loss.
MATIC Coin Price Intraday Levels
- Spot rate: $1.37
- Trend: Bearish
- Volatility: Low
- Resistance levels- $1.53-1.5, and $1.74-1.7.
- Support levels- $1.3 and $1.17

Why Trust CoinGape
CoinGape has covered the cryptocurrency industry since 2017, aiming to provide informative insights Read more…to our readers. Our journal analysts bring years of experience in market analysis and blockchain technology to ensure factual accuracy and balanced reporting. By following our Editorial Policy, our writers verify every source, fact-check each story, rely on reputable sources, and attribute quotes and media correctly. We also follow a rigorous Review Methodology when evaluating exchanges and tools. From emerging blockchain projects and coin launches to industry events and technical developments, we cover all facets of the digital asset space with unwavering commitment to timely, relevant information.

Related Articles


- Arthur Hayes Predicts BTC Price to Surge in 2026 Amid Dollar Liquidity Expansion
- Ethereum Staking Hits Record Highs as BitMine Continues to Stake ETH
- Crypto Bill News: U.S Senate Postpones Thursday’s Markup as Coinbase Pulls Support
- U.S. SEC Ends Zcash Foundation Probe as Dubai Tightens Rules on Privacy Tokens
- Sui Network Suffers Outage as Mainnet Stalls; SUI Price Flat
- Bitcoin Price Forecast: How the Supreme Court Tariff Decision Could Affect BTC Price
- Ethereum Price Prediction as Network Activity Hits ATH Ahead of CLARITY Markup
- Robinhood Stock Price Prediction: What’s Potential for HOOD in 2026??
- Cardano Price Prediction as Germany’s DZ Bank Gets MiCAR Approval for Cardano Trading
- Meme Coins Price Prediction: What’s Next for Pepe Coin, Dogecoin, and Shiba Inu Amid Market Rally?
- Standard Chartered Predicts Ethereum Price could reach $40,000 by 2030


