MATIC Price Finds Support for a Potential Rally to $0.745; Good Time to Buy?


The recent altcoin crash fueled the ongoing downtrend in MATIC price and plunged to yearly support of $0.518. From the peak of $0.95, this downfall tumbled the price by nearly 45% within a week. However, the daily chart shows a sharply lower price rejection at $0.518 on June 10th, revealing a high accumulation zone for buyers; Can coin buyers kickstart a fresh recovery from this level?
Also Read: Delisted MATIC Price Plummets as Whales Dump Tokens
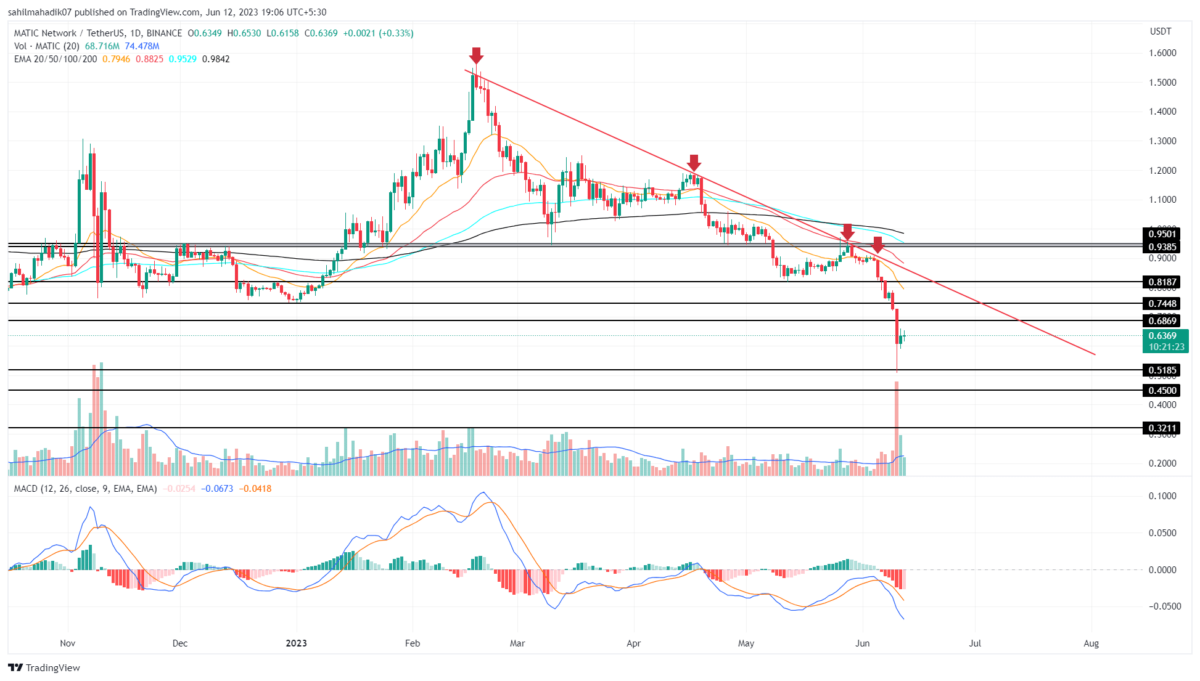
MATIC Price Daily Chart
- A potential reversal in MATIC price may face intense supply at $0.687 and $0.744
- The oversold RSI indicator reflects the coin price is trading at a heavy discount
- The intraday trading volume in the MATIC is $364.5 Million, indicating an 8.67% gain.
 Source-Tradingview
The Long-tail rejection candle at $0.518 support indicates the aggressive accumulation from buyers at lower levels. The coin price is 24% higher from the bottom support to current trade at $0.644.
The discounted MATIC price could attract more buyers and trigger a temporary pullback to $0.745. The potential rally could surge the price by 15%-18% to meet the long-coming resistance trendline(red).
The aforementioned resistance has maintained a steady downtrend in MATIC price and the potential traders seeking long-entry opportunities must wait for a breakout above this trendline.
Will MATIC Price Rise above $0.745?
The current relief rally in MATIC is likely triggered by the accumulation of this altcoin at discounted market value. Thus, with the overall trend still bearish, a recovery above $0.745 is less likely. If buyers face supply pressure at the in-between resistance of $0.68, the price may revisit $0.518 support.
- Exponential Moving Average: The coin price stretched far from its exponential moving average(20, 50, 100, and 200) reflecting instability in the current downtrend.
- Moving Average Convergence Divergence: The wide gap between the bearishly aligned MACD(blue) and signal(orange) highlights an aggressive downtrend in MATIC.

Why Trust CoinGape
CoinGape has covered the cryptocurrency industry since 2017, aiming to provide informative insights Read more…to our readers. Our journal analysts bring years of experience in market analysis and blockchain technology to ensure factual accuracy and balanced reporting. By following our Editorial Policy, our writers verify every source, fact-check each story, rely on reputable sources, and attribute quotes and media correctly. We also follow a rigorous Review Methodology when evaluating exchanges and tools. From emerging blockchain projects and coin launches to industry events and technical developments, we cover all facets of the digital asset space with unwavering commitment to timely, relevant information.

Related Articles


- Jane Street and Abu Dhabi Wealth Fund Mubadala Increase Holdings In BlackRock’s Bitcoin ETF
- FOMC Minutes Drop Tomorrow: Will Crypto Market Rally or Face Fed Shock?
- BlackRock Amends Filing For Staked Ethereum ETF, Eyes 18% of Staking Rewards From ETH Fund
- Arizona Advances Bitcoin, XRP Reserve Bill Using Seized Crypto Assets
- Bitcoin ETF Update: BlackRock Signals BTC Sell-Off as Kevin O’Leary Warns of Decline In Institutional Demand
- Pi Network Price Beats Bitcoin, Ethereum, XRP as Upgrades and Potential CEX Listing Fuels Demand
- 5 Things Dogecoin Price Needs to Hit $0.20 in Feb 2026
- Bitcoin Price Prediction as Experts Warns of Quantum Risks
- Dogecoin, Shiba Inu, Pepe Coin Price Predictions As BTC Crashes Below $68k
- Ethereum Price Outlook as Harvard Shifts Focus from Bitcoin to ETH ETF
- HOOD and COIN Stock Price Forecast as Expert Predicts Bitcoin Price Crash to $10k


