MATIC Price Heading to $0.5 Support; Buy this Dip?
Amid the recent correction phase in the crypto market, the MATIC price witnessed a V-top reversal from the $0.8819 resistance. This reversal evaporated the entire recovery from the buyers’ build during the June to mid-July recovery, heading towards the last swing low of $0.508. Will the ongoing downfall mark a new 2023 low for polygon coins?
Also Read: Reddit NFT Sale Crosses $40M; Polygon Founder Reveals What’s Next
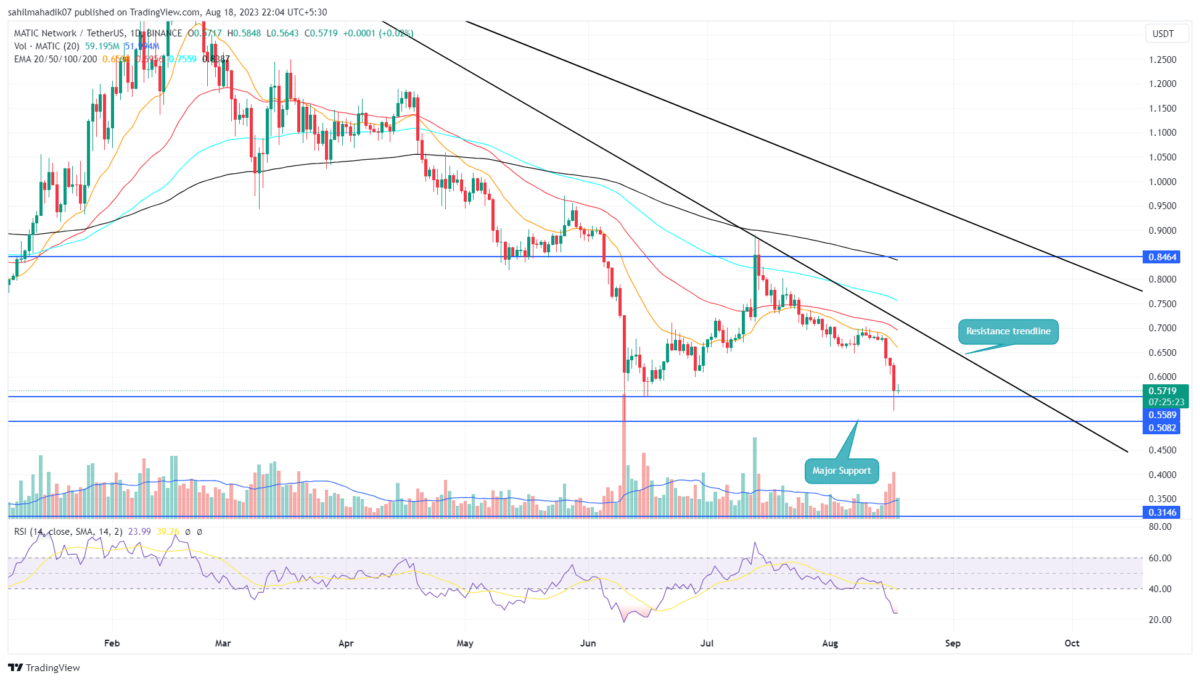
MATIC Price Daily Chart
- The polygon coin may witness strong accumulation at $0.5 psychological support
- A resistance trendline offers dynamic resistance to buyers
- The intraday trading volume of the MATIC coin is $400 Million, showing a 9.8% gain.
In the last five weeks, the MATIC price dropped from $0.8819 to the current price of $0.5722 registering around a 35% loss of market value. This downfall has brought the coin price to the last lower low which is $0.508, indicating the sellers may reattempt to further extend the downward trend.
The recent sell-off in the crypto market increased the bearish momentum and gave an additional push for a breakdown below $0.0508. If the daily candle is below the aforementioned support, the MATIC price may drop another 38% to reach the 18th June low of $0.316.
In addition, a downsloping trendline of the daily chart shows the direction of the current correction phase. Until this trendline is intact, the polygon coin may face aggressive selling.
[converter id=”matic-polygon” url=”https://coingape.com/price/converter/polygon-to-usd/?amount=1″]
Can Polygon Coin Recovery Back to $0.89?
Despite the massive sell-off witnessed during the early hours of August 15th, the buyers stepped in by day’s end and pushed the prices higher with long-tail rejection. This lower tail reflects the accumulation of buyers at the market dip, projecting the potential of a bullish reversal. In the coming days, if the price action shows a reversal from $0.56 or $0.5, the buyers could wait for a breakout above the overhead trendline to gain additional confirmation. This potential reversal may push the Polygon coming back to $0.891
- Exponential Moving Average: The dynamic resistance of 20-day EMA assists sellers to maintain aggressive downfall.
- Relative Strength Index: With concern to the two swings to $0.56 in the last two months, the daily RSI slope shows an evident rise inundating the increasing accumulation from buyers.
Recent Posts
- Price Analysis
Cardano Price Outlook: Will the NIGHT Token Demand Surge Trigger a Rebound?
Cardano price has entered a decisive phase as NIGHT token liquidity rotation intersects with structural…
- Price Analysis
Will Bitcoin Price Crash to $74K as Japan Eyes Rate Hike on December 19?
Bitcoin price continues to weaken after breaking below its recent consolidation range, now trading within…
- Price Analysis
Bitwise Predicts Solana Price Will Hit New All-Time Highs in 2026
Solana price declined by 4% over the past 24 hours, breaking below the key $130…
- Price Analysis
Bitcoin Price Outlook: Capriole Founder Warns of a Drop Below $50K by 2028
Bitcoin price narratives continue to evolve as long-term downside risks regain attention. Bitcoin price discussions…
- Price Analysis
XRP Price Rare Pattern Points to a Surge to $3 as ETFs Cross $1B Milestone
XRP price dropped by 1.2% today, Dec. 17, continuing a downward trend that started in…
- Price Analysis
DOGE Whales Add 138M Coins in 24 Hours: Will Dogecoin Price Rebound Above $0.15?
Dogecoin price traded at $0.1304 on Tuesday, up 1.39% in the last 24 hours.…