MATIC Price to $0.8? Bullish Pattern Hints End of Correction Phase
The second week of July has been aggressively bearish for the crypto market as the majority of major coins witness a significant correction. As a result, the MATIC price experienced a sharp reversal from the $0.89 resistance and tumbled 22.5% within three weeks. With an intraday loss of 1%, the daily chart hints at an extension of a downward trend. Should you sell?
Also Read: MATIC Price May Crash 22% Following Key Support Breakdown
MATIC Price Daily Chart:
- The polygon trading below the daily EMAs(20, 50, 100, and 200) indicates the overall market is bearish
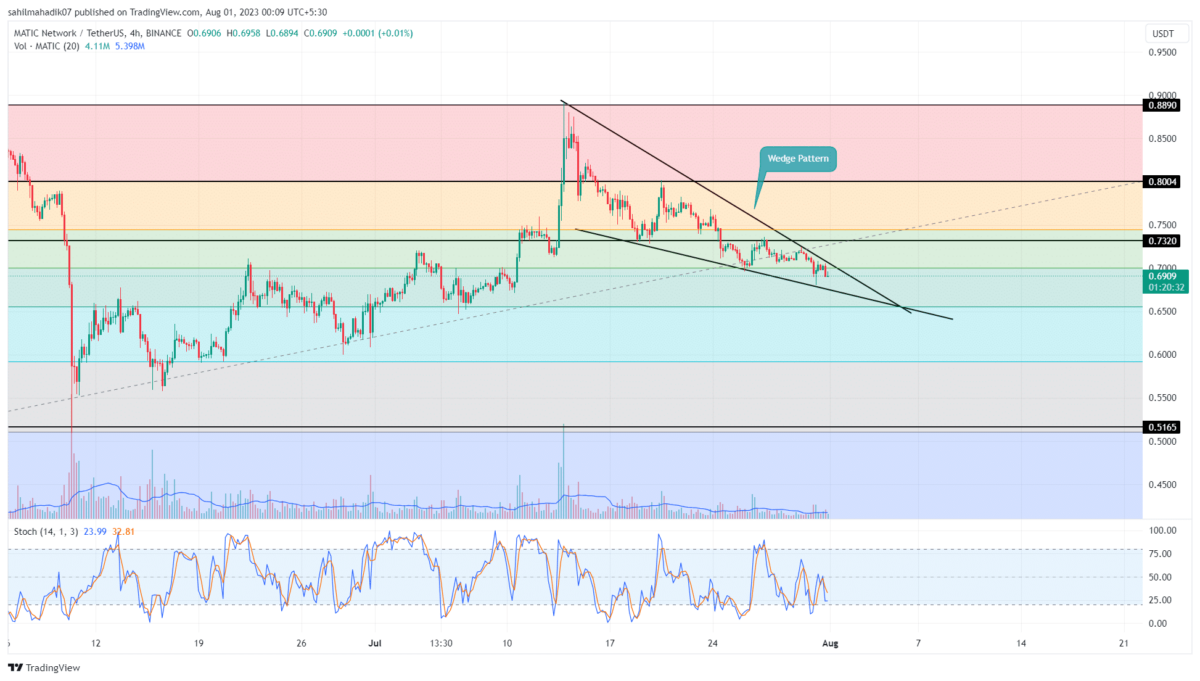
- An upside breakout from the wedge pattern could set the prices for a 28% upswing
- The intraday trading volume of the MATIC coin is $247.3 Million, showing a 27% gain.
A closer look at the 4-hour time frame chart shows a falling wedge pattern carrying the correction in polygon coin. This altcoin falling within two converging trendlines is about to reach its peak point indicating an upcoming breakout.
By the press time, the MATIC price trades at $0.69, with an intraday loss of 0.85%. The wedge pattern is known to trigger a massive upswing upon the breakout of its resistance trendline.
In theory, the wedge pattern formation indicates each swing high as a potential target to take partial profits. Thus, the post-breakout rally could surge the MATIC price to $0.73, followed by $0.8 and $0.83.
Can Polygon Price Plunge Back to $0.6?
Amid the wedge pattern development, the MATIC price obtained strong support from the lower trendline. Considering a pessimistic situation, a breakdown below the dynamic support will intensify the selling pressure and invalid the aforementioned bullish thesis, the price drop would hint at the continuation of the correction phase, possibly hitting the $0.6
- Fibonacci Retracement Level: A breakdown below the 50% FIB indicates the coin holders must remain cautious, as it is not a healthy sign of retracement.
- Stochastic: Multiple crossovers between the %K(blue) and %D(orange) slope reflect neutral sentiment among market participants.
Recent Posts
- Price Analysis
Pi Coin Price Prediction as Expert Warns Bitcoin May Hit $70k After BoJ Rate Hike
Pi Coin price rose by 1.05% today, Dec. 18, mirroring the performance of Bitcoin and…
- Price Analysis
Cardano Price Outlook: Will the NIGHT Token Demand Surge Trigger a Rebound?
Cardano price has entered a decisive phase as NIGHT token liquidity rotation intersects with structural…
- Price Analysis
Will Bitcoin Price Crash to $74K as Japan Eyes Rate Hike on December 19?
Bitcoin price continues to weaken after breaking below its recent consolidation range, now trading within…
- Price Analysis
Bitwise Predicts Solana Price Will Hit New All-Time Highs in 2026
Solana price declined by 4% over the past 24 hours, breaking below the key $130…
- Price Analysis
Bitcoin Price Outlook: Capriole Founder Warns of a Drop Below $50K by 2028
Bitcoin price narratives continue to evolve as long-term downside risks regain attention. Bitcoin price discussions…
- Price Analysis
XRP Price Rare Pattern Points to a Surge to $3 as ETFs Cross $1B Milestone
XRP price dropped by 1.2% today, Dec. 17, continuing a downward trend that started in…