Multiple Resistances Restrict Shiba Inu Price Rally to $0.00008; What’s Next?


In the daily timeframe chart, the Shiba Inu (SHIB) price shows a significant upswing that started from $0.00000642. This rise in buying pressure has likely triggered buyers’ interest in accumulating this Dog-themed memecoin at a discounted price. The potential for further upside is around 6% before encountering a significant resistance formed by a downsloping trendline. However, the question remains whether this rally is sustainable or if bears might regain control after selling at a higher price.
Also Read: Shiba Inu Lead Developer Teases New Product is Enroute
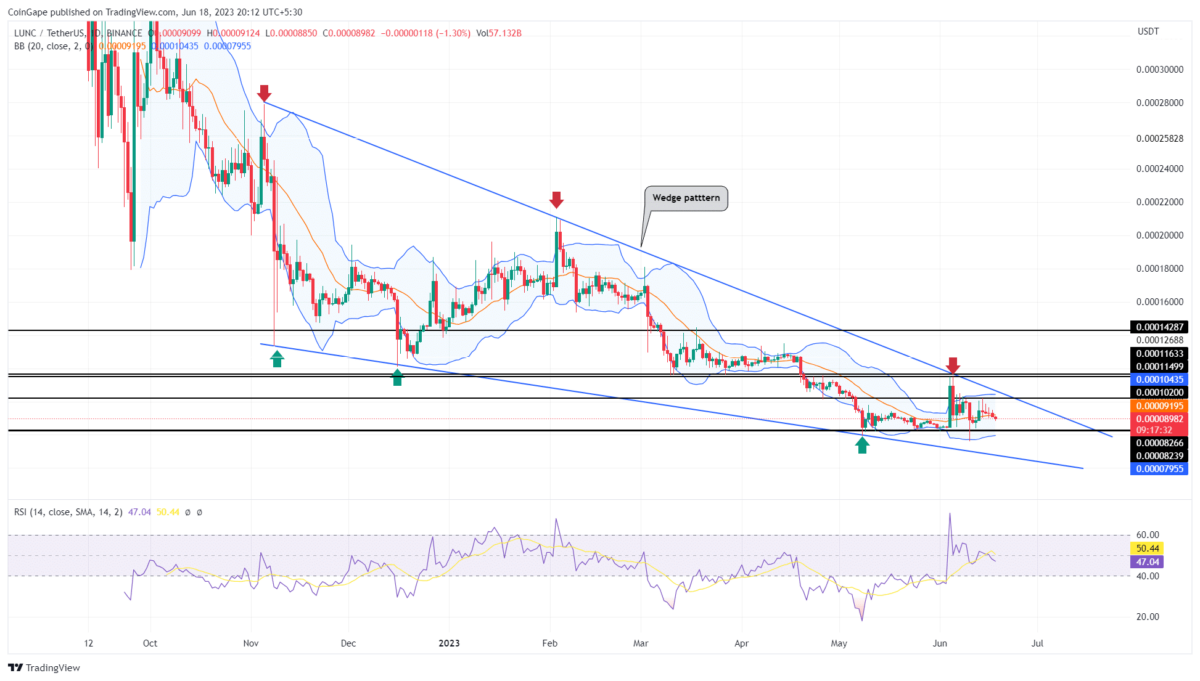
Shiba Inu Price Daily Chart:
- A bullish breakout from the $0.0000072 resistance sets the memecoin’s price up for a quick 6% rise.
- The SHIB price exhibits a temporary relief rally before the downtrend potentially resumes.
- The intraday trading volume of Shiba Inu coin is $120.5 million, indicating a 68% loss.
 (Source: Tradingview)
Over the course of four consecutive days, the SHIB price recorded a 13% growth, reaching the current trading price of $0.00000742. With a sustained rally, prices are likely to rise by 6% before encountering combined resistance at $0.00000783 and the downsloping trendline.
This resistance trendline has been hindering bullish growth in the Shiba Inu coin for the past four months. Therefore, a potential retest could replenish selling momentum and reinforce the continuation of the prevailing downtrend.
For SHIB buyers to maintain trend control, the coin price must breach the overhead trendline with a daily candle closing above it.
Will Shiba Inu Kickstart a New Recovery Cycle?
Following the recent price jump, the SHIB price surpassed the minor resistance at $0.0000072, providing buyers with a solid foundation to ascend in the price chart. However, buyers are currently struggling at the 20-day exponential moving average (EMA) slope, which has acted as a barrier preventing progress for over two months. Thus, the daily chart highlights several resistances that could impede sustained growth in Shiba Inu prices.
- Average Directional Index: The high value of the average directional index (ADX) slope reflects instability in the current downtrend, indicating the need for relief before the further downfall.
- Exponential Moving Average: The 20-day and 50-day EMA slopes serve as dynamic resistance against rising prices.

Why Trust CoinGape
CoinGape has covered the cryptocurrency industry since 2017, aiming to provide informative insights Read more…to our readers. Our journal analysts bring years of experience in market analysis and blockchain technology to ensure factual accuracy and balanced reporting. By following our Editorial Policy, our writers verify every source, fact-check each story, rely on reputable sources, and attribute quotes and media correctly. We also follow a rigorous Review Methodology when evaluating exchanges and tools. From emerging blockchain projects and coin launches to industry events and technical developments, we cover all facets of the digital asset space with unwavering commitment to timely, relevant information.
Related Articles


- Bitcoin Reclaims $70K as Experts Signal a BTC Bottom
- 3 Reasons Why the XRP Price Is Up 20% Today
- China Tightens Stablecoin Rules as Bessent Urges Congress to Pass CLARITY Act to Keep Crypto Lead
- Bitget Launches ‘Fan Club’ Initiative In Bid To Strengthen Community Amid Crypto Crash
- BlackRock Signals More Selling as $291M in BTC, ETH Hit Coinbase Amid $2.5B Crypto Options Expiry
- Bitcoin Price Prediction as Funding Rate Tumbles Ahead of $2.1B Options Expiry
- Ethereum Price Outlook as Vitalik Buterin Sells $14 Million Worth of ETH: What’s Next for Ether?
- Solana Price at Risk of Crashing Below $50 as Crypto Fear and Greed Index Plunges to 5
- Pi Network Price Prediction Ahead of PI KYC Validator Reward System Launch
- XRP Price Outlook As Peter Brandt Predicts BTC Price Might Crash to $42k
- Will Cardano Price Rise After CME ADA Futures Launch on Feb 9?


