Overhead Supply Puts Shiba Inu Price At Risk of $0.000007 Breakdown; Sell or Hold?


SHIB Price Analysis: For over a week, the popular meme cryptocurrency Shiba Inu showed several failed attempts to break the long-coming resistance trendline. This downsloping trendline has carried a downtrend in this token from February 2023 and continues to pressurize prices to lower levels. Can buyers retake control as the market trend shows signs of recovery?
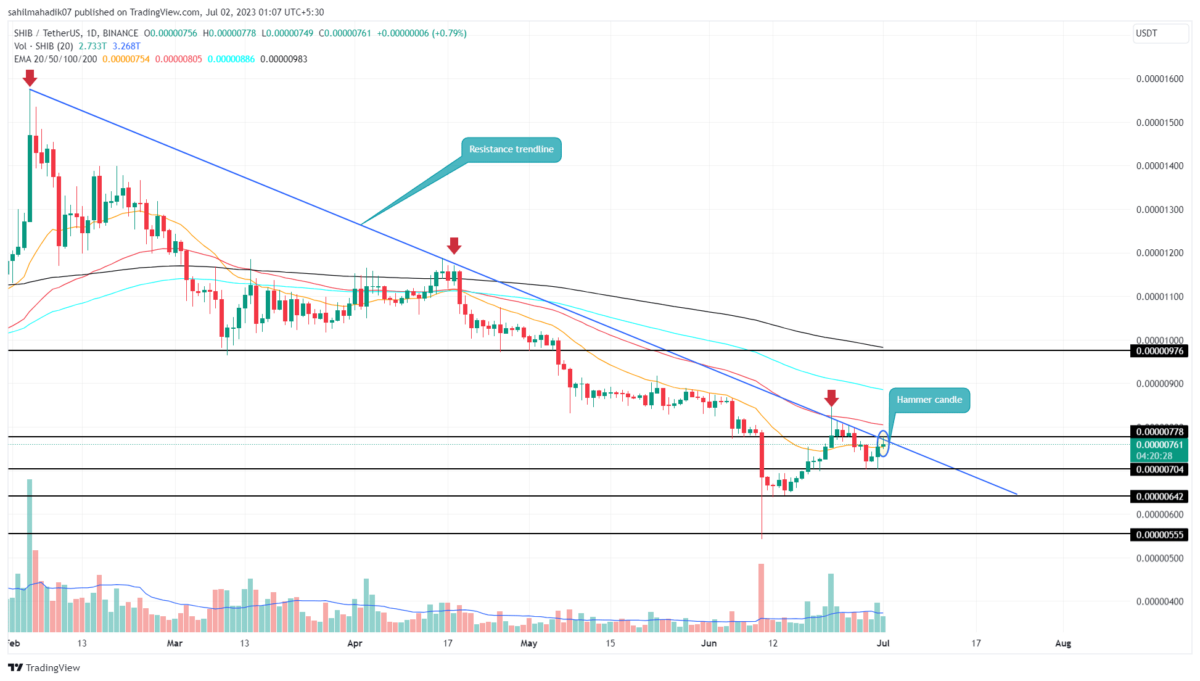
Shiba Inu Price Daily Chart:
- The falling trendline maintains a downward trend in the Shiba Inu price
- A breakdown below $0.000007 could plunge the coin price by 9%
- The intraday trading volume of the Shiba Inu coin is $125 Million, showing a 29% loss.
 Source- Tradingview
Currently, the Shiba Inu price trades at $0.00000759 and shows an intraday rise of 0.65%. With today’s bullish candle, the buyers tried to breach the resistance trendline but were undermined by high supply pressure which created a bearish hammer candle.
This higher price rejection candle indicates sellers continue to defend the overhead trendline. If selling momentum persists, the coin price could break below the immediate support of $0.000007 psychologically support.
This breakdown would accelerate the supply pressure and may plunge the SHIB price another 9% to hit the June bottom support of $0.00000642.
When’s the Right Time to Buy Shiba Inu?
According to the Dow theory of the financial market, the trend remains the same in asset prices. Therefore, the SHIB price is currently witnessing a steady downtrend but could soon trigger a trend change as the broader market shows signs of recovery. A breakout above the downsloping trendline will signal an early sign of trend reversal and an entry opportunity.
- Relative Strength Index: The RSI slope sustaining above 40% reflects that the buyers are attempting to regain higher prices.
- Exponential Moving Average: The 50-day EMA falling parallel to the overhead trendline offers additional selling pressure.

Why Trust CoinGape
CoinGape has covered the cryptocurrency industry since 2017, aiming to provide informative insights Read more…to our readers. Our journal analysts bring years of experience in market analysis and blockchain technology to ensure factual accuracy and balanced reporting. By following our Editorial Policy, our writers verify every source, fact-check each story, rely on reputable sources, and attribute quotes and media correctly. We also follow a rigorous Review Methodology when evaluating exchanges and tools. From emerging blockchain projects and coin launches to industry events and technical developments, we cover all facets of the digital asset space with unwavering commitment to timely, relevant information.

Related Articles


- U.S. CFTC Committee Appoint Ripple, Coinbase, Robinhood CEOs to Boost Crypto Regulation
- What Will Spark the Next Bitcoin Bull Market? Bitwise CIO Names 4 Factors
- U.S. CPI Release: Wall Street Predicts Soft Inflation Reading as Crypto Market Holds Steady
- Bhutan Government Cuts Bitcoin Holdings as Standard Chartered Predicts BTC Price Crash To $50k
- XRP News: Binance Integrates Ripple’s RLUSD on XRPL After Ethereum Listing
- Solana Price Prediction as $2.6 Trillion Citi Expands Tokenized Products to SOL
- Bitcoin Price Could Fall to $50,000, Standard Chartered Says — Is a Crash Coming?
- Cardano Price Prediction Ahead of Midnight Mainnet Launch
- Pi Network Price Prediction as Mainnet Upgrade Deadline Nears on Feb 15
- XRP Price Outlook Amid XRP Community Day 2026
- Ethereum Price at Risk of a 30% Crash as Futures Open Interest Dive During the Crypto Winter


