Overhead Supply Puts Shiba Inu Price At Risk of $0.000007 Breakdown; Sell or Hold?
SHIB Price Analysis: For over a week, the popular meme cryptocurrency Shiba Inu showed several failed attempts to break the long-coming resistance trendline. This downsloping trendline has carried a downtrend in this token from February 2023 and continues to pressurize prices to lower levels. Can buyers retake control as the market trend shows signs of recovery?
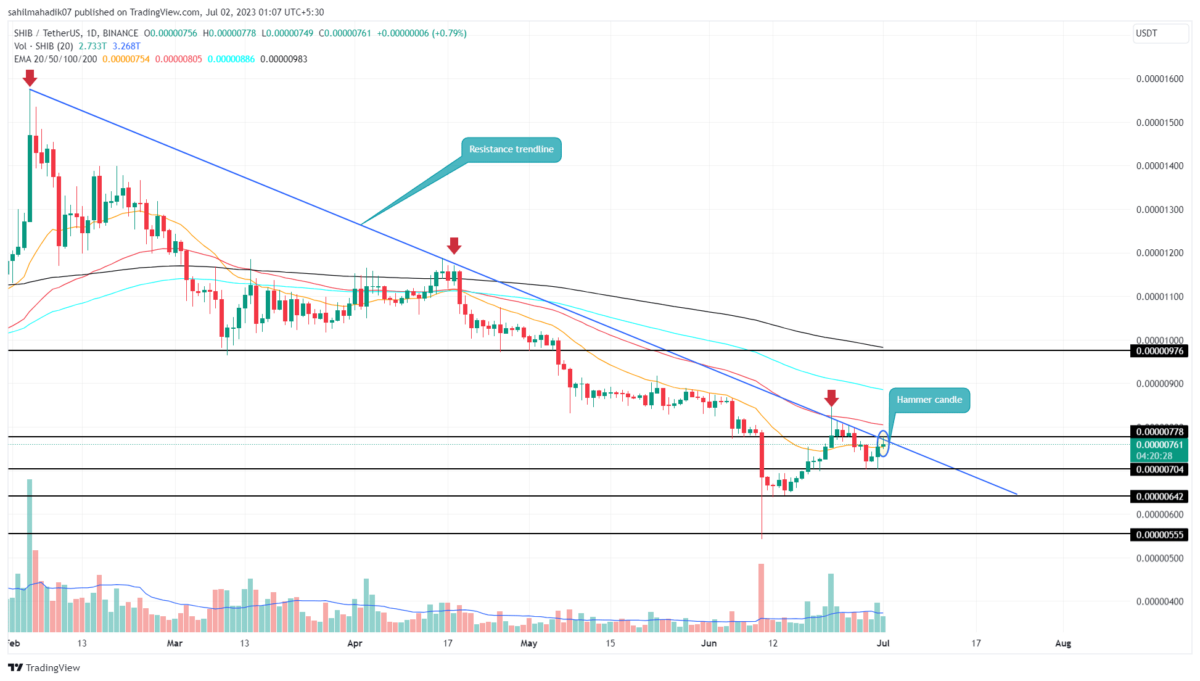
Shiba Inu Price Daily Chart:
- The falling trendline maintains a downward trend in the Shiba Inu price
- A breakdown below $0.000007 could plunge the coin price by 9%
- The intraday trading volume of the Shiba Inu coin is $125 Million, showing a 29% loss.
Currently, the Shiba Inu price trades at $0.00000759 and shows an intraday rise of 0.65%. With today’s bullish candle, the buyers tried to breach the resistance trendline but were undermined by high supply pressure which created a bearish hammer candle.
This higher price rejection candle indicates sellers continue to defend the overhead trendline. If selling momentum persists, the coin price could break below the immediate support of $0.000007 psychologically support.
This breakdown would accelerate the supply pressure and may plunge the SHIB price another 9% to hit the June bottom support of $0.00000642.
When’s the Right Time to Buy Shiba Inu?
According to the Dow theory of the financial market, the trend remains the same in asset prices. Therefore, the SHIB price is currently witnessing a steady downtrend but could soon trigger a trend change as the broader market shows signs of recovery. A breakout above the downsloping trendline will signal an early sign of trend reversal and an entry opportunity.
- Relative Strength Index: The RSI slope sustaining above 40% reflects that the buyers are attempting to regain higher prices.
- Exponential Moving Average: The 50-day EMA falling parallel to the overhead trendline offers additional selling pressure.
Recent Posts
- Price Analysis
Expert Predicts Ethereum Price Rebound to $4k as BitMine, Long-Term Holders Buy
Ethereum price rose by 1.5% today and moved slightly above the important resistance level at…
- Price Analysis
Bitcoin Price Prediction Ahead of FOMC Minutes
Bitcoin price continues trading within a tightening range, with BTC price holding between $88,000 and…
- Price Analysis
Top 3 Crypto Predictions Ahead of U.S. Government Shutdown Deadline in Jan 2026
The crypto market gained 1.07% in the last 24 hours, showing renewed strength across major…
- Price Analysis
Grayscale Files for First U.S. Bittensor ETF: Will TAO Price Rally to $300 in January?
Bittensor (TAO) price climbed above $220 in the last 24 hours after Grayscale filed for…
- Price Analysis
Shiba Inu Price Prediction: Will SHIB Show Golden Cross Signal in 2026?
Discussion around a potential Golden Cross in 2026 has intensified as Shina Inu price compresses…
- Price Analysis
Pi Network Price Prediction as Demand Slips Ahead of the 136m Unlock
Pi Network price is stuck in a bear market this month, and odds are high…