PEPE Coin Price Analysis: Can $0.0000008 Support Defy the Downward Trend?


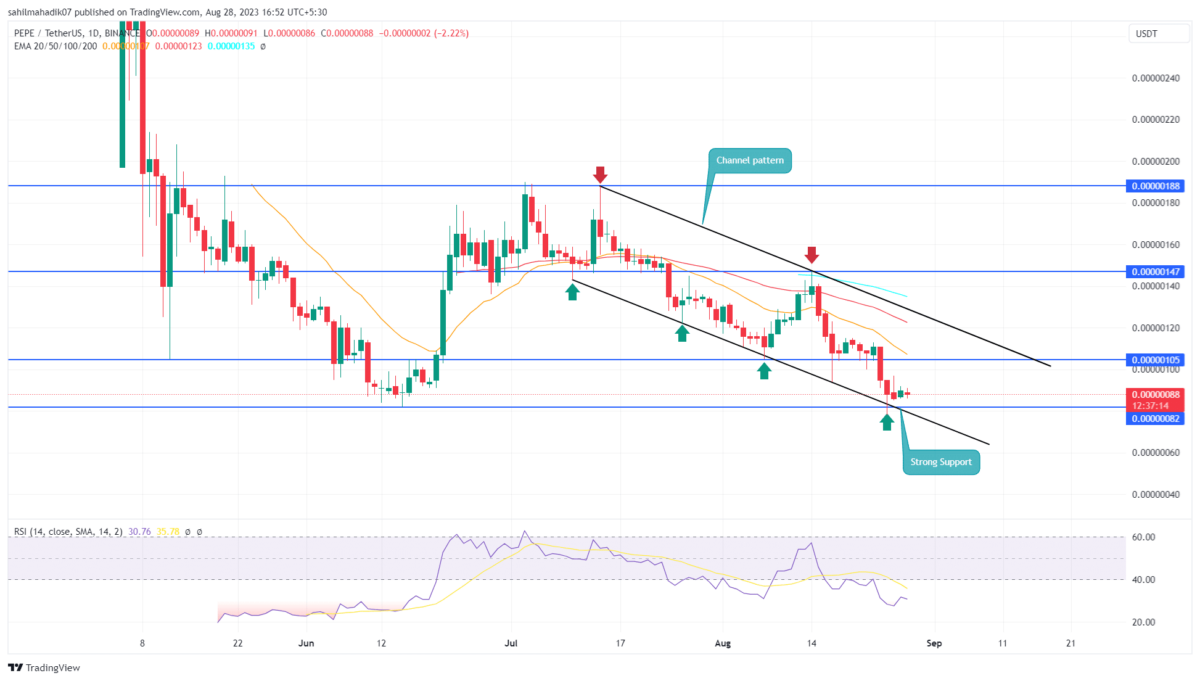
In response to increasing bearishness in the crypto market, the PEPE buyers are struggling to rebound from the combined support of $0.0000082 and the lower trendline of the channel pattern. This chart pattern maintains the ongoing correction, offering sellers a dynamic resistance trendline to sell on bullish bounces, the coin price at a lower trendline reflects the possibility of a minor pullback in the downward trend.
Also Read: Pepe Coin Team Gives Clarification Of The 16 Trillion Pepe Tokens Theft
Pepe Coin Daily Chart: Key Points
- The rising demand pressure at $0.00000088 support has halted the current correction mode.
- A possible bullish reversal from a lower trendline could raise the coin price by 36%.
- The 24-hour trading volume in the Pepe coin is $48.6 Million, indicating a 27.5% loss.

Source-Tradingview
On August 25th, the falling Pepe coin price plunged to the 0.00000082 low eroding the enterer gain collected during the June-July rally. The aforementioned support aligned with the bottom trendline of a downsloping channel pattern and offered buyers with additional push to rebound.
In the last three days, the coin price showed several failed attempts to rise higher indicating the overhead supply is intense. With an intraday loss of 3.33%, the PEPE price plunged back to the current trading price of $0.00000088 mark.
If the bearish momentum rises, the sellers may attempt a breakdown below $0.00000082 and channel support. This fall may signal the continuation of the downward trend and may plunge the prices below $0.0000007.
Can Pepe Coin Hold the $0.0000008 level?
Amid the three weeks’ downfall, the Pepe coin price has rebounded from this pattern’s support trendline multiple times, indicating that the buyers are actively accumulating at this level. Therefore, the potential sellers must remain cautious as until this memecoin wobbles above this trendline, the buyers could rebound the price higher. In addition, the channel pattern often leads to a change in market trend upon the breakout of the overhead trendline.

Why Trust CoinGape
CoinGape has covered the cryptocurrency industry since 2017, aiming to provide informative insights Read more…to our readers. Our journal analysts bring years of experience in market analysis and blockchain technology to ensure factual accuracy and balanced reporting. By following our Editorial Policy, our writers verify every source, fact-check each story, rely on reputable sources, and attribute quotes and media correctly. We also follow a rigorous Review Methodology when evaluating exchanges and tools. From emerging blockchain projects and coin launches to industry events and technical developments, we cover all facets of the digital asset space with unwavering commitment to timely, relevant information.