Pepe Coin Price Prediction As Bearish Pattern Points to 22% Fall

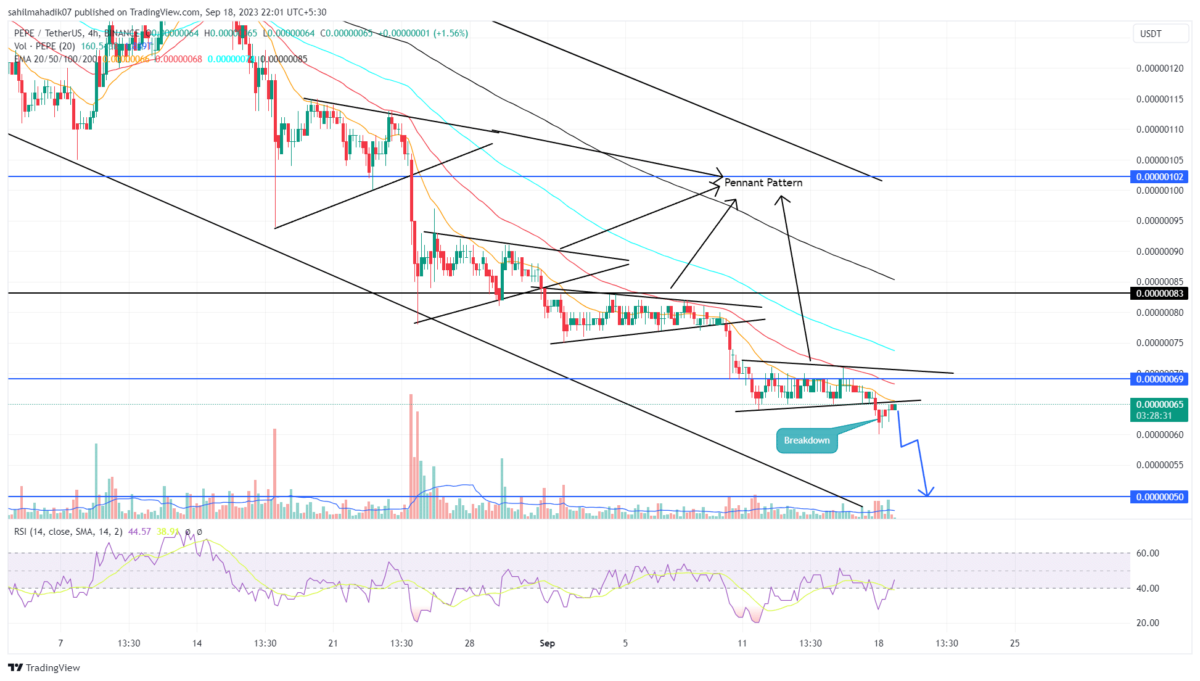
The Pepe price trajectory is sketching out a repetitive pattern identifiable as a bearish pennant during its present correctional journey. A closer examination of the 4-hour chart pinpoints that subsequent to a marked decline, the PEPE price often adopts a lateral movement, seemingly recuperating its dwindling bearish energy. This trend was prominently visible in its consolidation throughout the past week. However, a recent plummet below its support trendline hints at the potential for further downfall.
PEPE Price Heading to $0.0000005
- A bearish pattern formation threatens the coin holders for prolonged correction
- The falling coin price may witness demand pressure at the $0.0000005 mark
- The 24-hour trading volume in the Pepe coin is $27.2 Million, indicating a 32% loss.
 Source- Trading
On September 17th, the Pepe coin price demonstrated a decisive plunge below the support trendline of its pennant pattern. Such a downward thrust grants bearish traders an added edge to exert further downward pressure on the assets’ valuation.
Despite this, the broader bullish sentiment reverberating throughout the crypto sphere has driven the price to register a 3.2% intraday appreciation, effectively nudging the price to confront the recently breached support, but this time, as potential resistance.
At the moment of this analysis, the ‘frog-themed memecoin,’ stands at $0.00000064. Should it maintain its stance beneath this recently compromised support, bearish traders might capitalize on this to further the correctional trajectory by approximately 22%, directing the coin towards the $0.0000005 benchmark.
PEPE vs DOGE vs SHIB Performance
 Source: Coingape| Pepe Coin vs Dogecoin Vs Shiba Inu Price
Delving deeper into the price dynamics of renowned meme-based cryptocurrencies over the trailing quarter, the Pepe price volatility emerges starkly when compared against the Dog-theme Shiba Inu price and Dogecoin price.
The price chart shows the Pepe Coin has been under a steady downward journey since mid-July and continues to plunge lower with high momentum selling.
Contrarily, the price action of both SHIB and DOGE exudes relative stability, with both coins navigating a shorter-term lateral phase
- Relative Strength Index (RSI): The RSI slope below the 40% mark reflects aggressive selling momentum
- Exponential Moving Average (EMA): the 20 and 50 EMA slopes exert dynamic resistance in bullish upswings


- Polymarket Traders Slash Trump Tariff Odds by 26% After Justices Question Legality, Bitcoin Jumps
- Breaking: Ripple, Mastercard, Gemini Partner to Enable RLUSD Stablecoin Settlement for Fiat Cards
- White House Defends Trump’s Pardon of Binance Founder CZ Amid Corruption Allegations
- Ripple Secures $500M Funding Led by Fortress and Citadel Securities After Record Growth
- Teucrium ETFs CEO Says Late November Will Be ‘Big’ For XRP At Swell 2025
- Solana Price Faces Heavy Sell Pressure as $1.36B Is Liquidated: $100 Incoming?
- XRP Price Prediction: Ripple Swell 2025, ETF Hints, RLUSD Plans, and Market Outlook
- Expert Predicts Cardano Price Surge as Hoskinson Touts Midnight Potential
- Changpeng Zhao Sparks Bull Run Aster Price Jumps 10%, Eyes $2 Breakout
- Whales Scoop 323,523 ETH Amid Price Dip – Is Ethereum Price Correction Setting Up a 10K Wave?
- How Solana, XRP, and Cardano Reacting as U.S. Shutdown Becomes Longest in History


Why Trust CoinGape
CoinGape has covered the cryptocurrency industry since 2017, aiming to provide informative insights Read more…to our readers. Our journal analysts bring years of experience in market analysis and blockchain technology to ensure factual accuracy and balanced reporting. By following our Editorial Policy, our writers verify every source, fact-check each story, rely on reputable sources, and attribute quotes and media correctly. We also follow a rigorous Review Methodology when evaluating exchanges and tools. From emerging blockchain projects and coin launches to industry events and technical developments, we cover all facets of the digital asset space with unwavering commitment to timely, relevant information.