PEPE Coin Price Prediction as Weekly Outflows Hit $17M – Is Rebound Ahead?

Highlights
- PEPE coin price consolidates within a long-term accumulation zone, signaling potential bullish reversal.
- MACD crossover and reduced sell pressure strengthen the case for an extended recovery phase.
- Around $17M weekly exchange outflows suggest rising confidence among holders and long-term investors.
Pepe coin price has remained under pressure despite renewed signals of investor repositioning in the market. Exchange data suggests that holders are quietly shifting tokens away from trading platforms, signaling a potential phase of accumulation. On the chart, PEPE continues to trade within a broader descending pattern while stabilizing near a familiar demand area.
Pepe Coin Price Action: Accumulation Zone Sets Stage for a 180% Rally
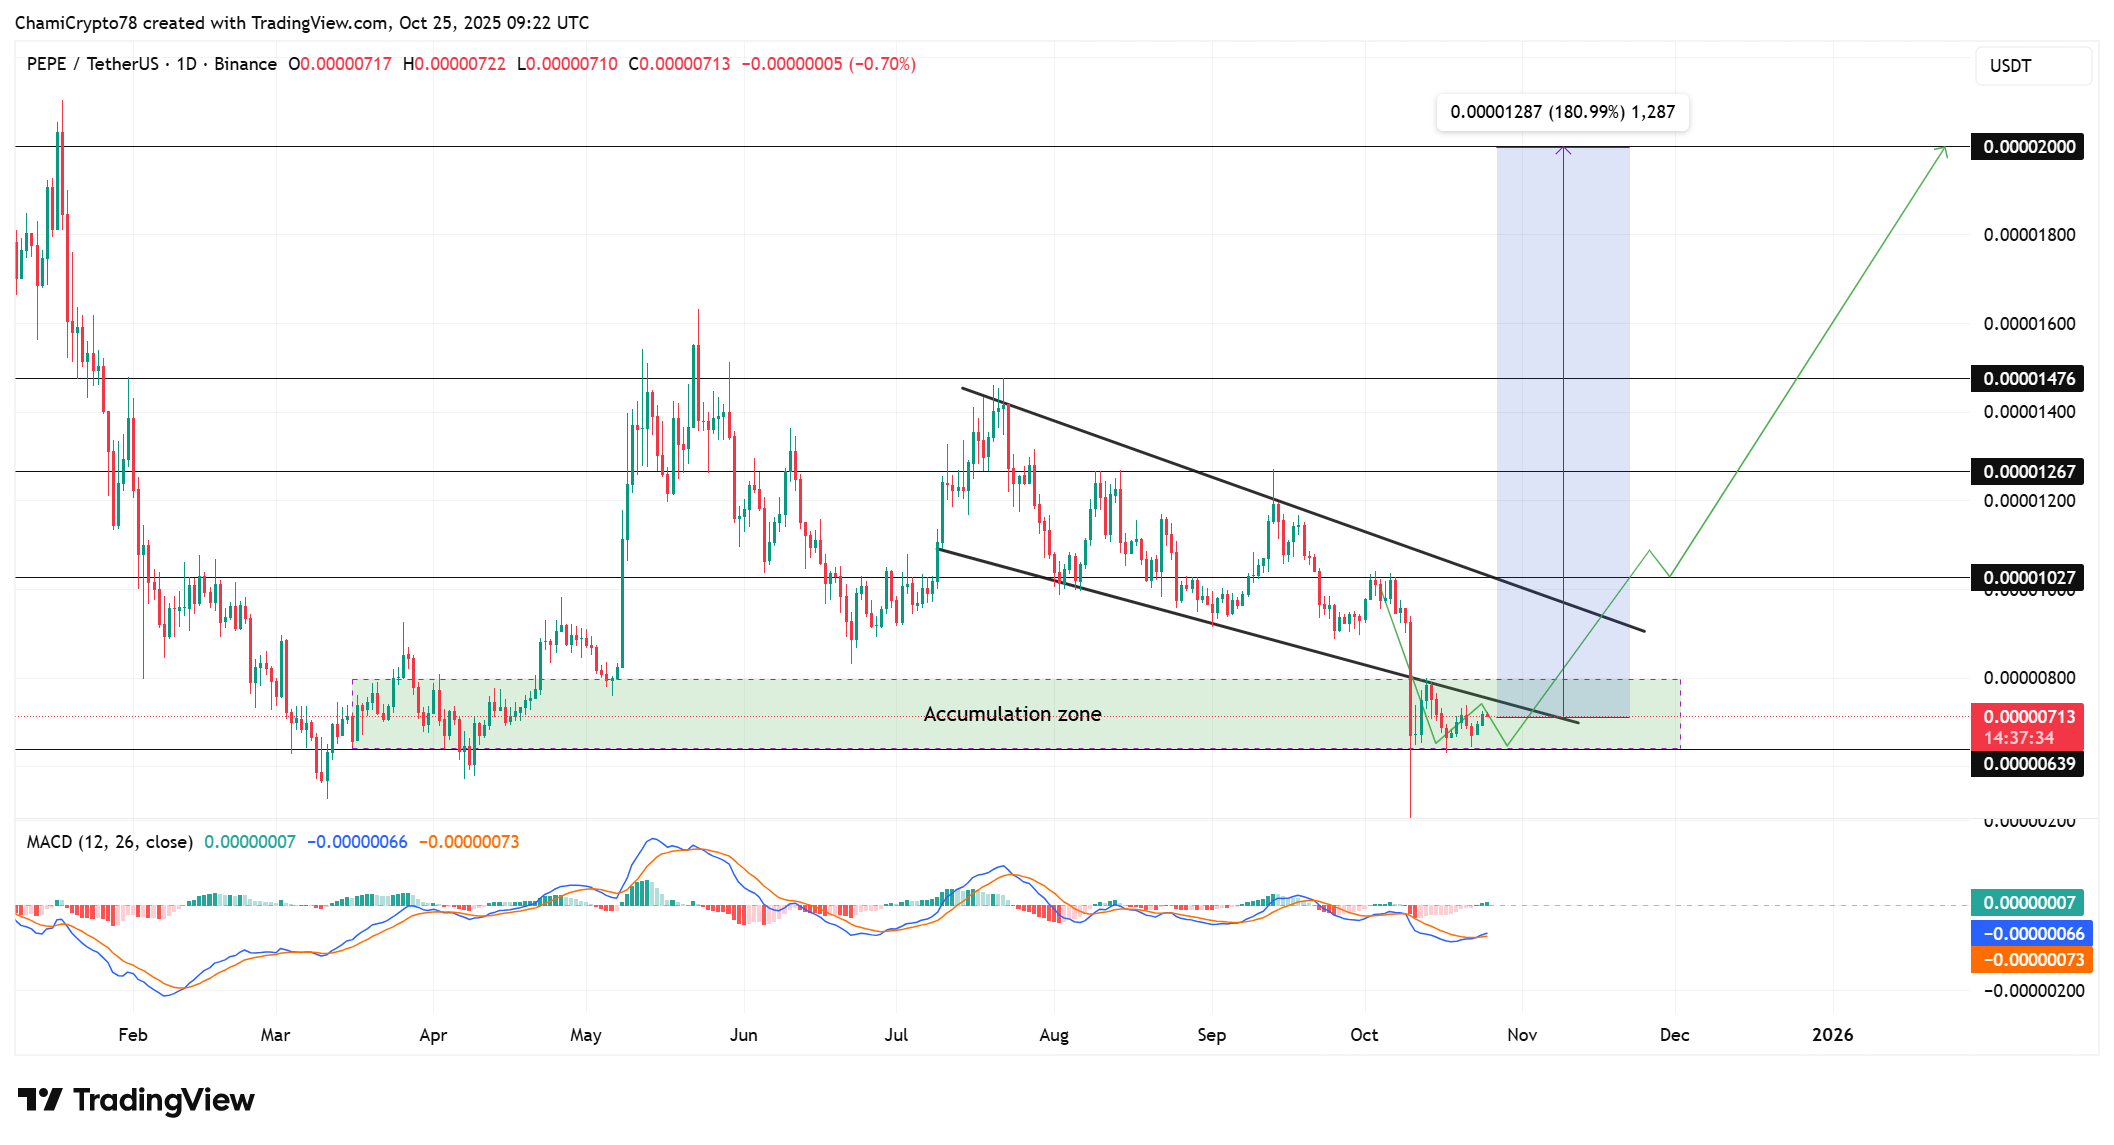
Pepe coin price has been confined within a descending channel since mid-June, forming lower highs that reflected sustained selling pressure. However, the latest consolidation near $0.000007 marks a potential accumulation phase, as PEPE now trades between $0.0000063 and $0.0000075.
Notably, this accumulation zone was previously identified as a strong historical demand area that triggered a sharp rebound earlier this year, underscoring renewed interest from long-term participants. The coin briefly dipped below the lower boundary but quickly recovered, showing that buyers are defending this level with conviction.
Meanwhile, the MACD indicator has crossed above its signal line, indicating an early sign of bullish rotation. From a long-term Pepe coin price forecast perspective, reclaiming resistance at $0.00001027 could pave the way toward $0.00001267 and $0.00001476.
If PEPE sustains strength above these levels, a 180% move to $0.000020 remains plausible, backed by historical accumulation behavior and easing sell pressure.

Weekly Outflows Reinforce the Accumulation Narrative
Over the last seven days, PEPE recorded nearly $17 million in net outflows from exchanges, extending a strong multi-week trend, as per CoinGlass analytics. This consistent withdrawal pattern reflects long-term investor conviction and reduced selling pressure across the market.
Notably, such behavior aligns with accumulation signals seen on the daily chart, reinforcing expectations of an upcoming shift in sentiment. As coins leave exchanges, circulating supply tends to tighten, amplifying future price reactions once buyers re-enter aggressively.
Meanwhile, the continued absorption within the $0.0000063–$0.0000075 range aligns with previous cycle baselines where sharp reversals began. Among the top meme coins, this steady outflow trend underscores growing accumulation interest despite subdued short-term activity.
Therefore, the interplay between technical accumulation and exchange outflows could serve as a precursor to PEPE’s next rally attempt.
Recovery Ahead?
Pepe coin price is gradually stabilizing after months of bearish pressure, supported by positive technical and on-chain cues. The $17 million outflows strengthen the argument for ongoing accumulation beneath key support. If PEPE holds its current base and reclaims $0.00001027, the likelihood of a rally toward $0.000020 rises significantly. Altogether, signs point toward improving conditions for a recovery-led breakout.
Frequently Asked Questions (FAQs)
1. What does the accumulation zone indicate for PEPE?
2. How do exchange outflows impact Pepe’s market outlook?
3. Why is PEPE considered one of the top meme coins?
- Breaking: U.S. CPI Inflation Falls To 4-Year Low Of 2.4%, Bitcoin Rises
- Bitget Launches Gracy AI For Market Insights Amid Crypto Platforms Push For AI Integration
- BlackRock Signals $257M Bitcoin and Ethereum Sell-Off Ahead of Partial U.S. Government Shutdown
- XRP News: Jane Street Emerges Among Key Institutions Driving XRP ETF Inflows
- Bhutan Gov. Dumps More Bitcoin Amid $410M Institutional Sell-Off in BTC ETFs
- Bitcoin Price Outlook As Gold And Silver Lose $3.6 Trillion in Market Value
- XRP and Ethereum Price Prediction as Trump Seeks to Lower Key Tariffs
- Solana Price Prediction as $2.6 Trillion Citi Expands Tokenized Products to SOL
- Bitcoin Price Could Fall to $50,000, Standard Chartered Says — Is a Crash Coming?
- Cardano Price Prediction Ahead of Midnight Mainnet Launch
- Pi Network Price Prediction as Mainnet Upgrade Deadline Nears on Feb 15


