Pepe Coin Price Prediction As Buyers Breached 100 Days Resistance


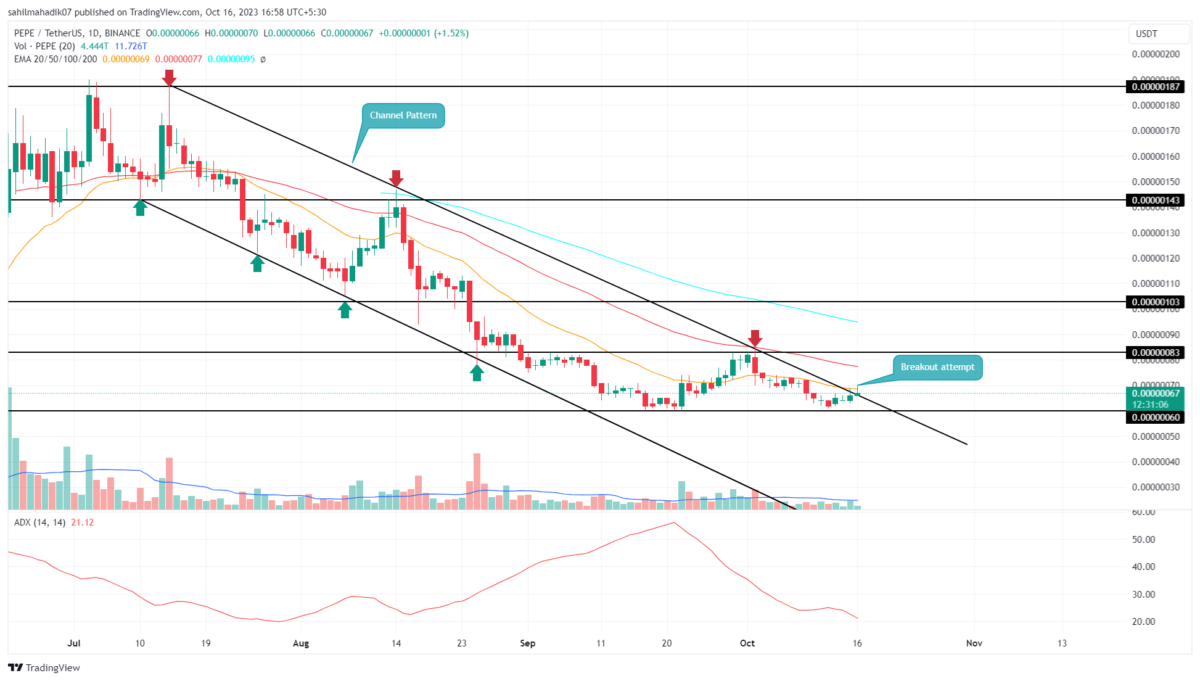
Over the last quarter, the PEPE price has been on a persistent downward trajectory, guided by a falling channel pattern. The pattern’s dual trendlines have served as dynamic levels of resistance and support, underscoring their influence on trader behavior. Interestingly, with the leading cryptocurrency Bitcoin rebounding from the $26,500 mark, the Pepe buyers attempted a fresh recovery with the bullish breakout from this pattern.
Also Read: Shiba Inu And Dogecoin Get Listed On BitTrade, Price To Rally?
Will Buyers Reclaim $0.000001?
- A bullish breakout from the channel pattern set an early sign of recovery
- The potential rally may face supply pressure at $0.00000083 and $0.000001
- The 24-hour trading volume in the Pepe coin is $60 Million, indicating a 55% gain.
 Source- Tradingview
Following the recent sell-off in the crypto market, the Pepe coin price began to find buying interest around the $0.0000006 demand zone. As a result, the coin price surged 11.5% over four days, elevating its current trading value to $0.00000068.
This upward movement led to a break above the upper trendline of the longstanding falling channel, a structure that has dictated the memecoin’s bearish run for nearly 100 days. For this breakout to be considered valid, the breakout candle must close above this trendline, coupled with a spike in trading volume.
Should these conditions be met, the asset may be poised for a sustained recovery rally. Theoretically, previous swing highs that tested the upper trendline could serve as future targets post-breakout.
In such a case, the PEPE price could surge another 22% to reach $0.00000083 and potentially aim for $0.000001 and $0.00000043 levels after that.
Is PEPE Price at Risk of Losing $0.0000006?
The ongoing breakout appears to lack robust volume, signaling potential fragility in the newfound bullish momentum. If the coin fails to maintain its position above the breached trendline by the end of the day, the bullish narrative will be compromised. Such a scenario could reignite selling pressure, potentially extending the coin’s downtrend below the $0.0000006 level.
- Exponential Moving Average: The 20-day EMA slope continues to act as major resistance in bullish upswings.
- Average Directional Index: Despite a bullish breakout from significant resistance, the ADX price with no uptick reflects a lack of buyer participation.

Why Trust CoinGape
CoinGape has covered the cryptocurrency industry since 2017, aiming to provide informative insights Read more…to our readers. Our journal analysts bring years of experience in market analysis and blockchain technology to ensure factual accuracy and balanced reporting. By following our Editorial Policy, our writers verify every source, fact-check each story, rely on reputable sources, and attribute quotes and media correctly. We also follow a rigorous Review Methodology when evaluating exchanges and tools. From emerging blockchain projects and coin launches to industry events and technical developments, we cover all facets of the digital asset space with unwavering commitment to timely, relevant information.
Pepe
24 Hours volume
$295.91M
Market Cap
$1.78B
Max Supply
420.69T
Related Articles


- XRP Price Rebounds from 2-Year Low: Here’s Why
- Bitcoin Price Rebounds to $78K as BTC ETFs Flip Back to $561M Inflows
- Ethereum Slips as Vitalik Buterin Moves 5,493 ETH, Trend Research Dumps 20K ETH
- Why Is Cathie Wood Buying $6M BMNR Stocks Despite BitMine’s Deep Ethereum Losses
- Crypto Bill: Banks, Crypto Firms Face February Deadline on Stablecoin Yield Rules
- Top 3 Meme coin Price Prediction: Dogecoin, Shiba Inu And MemeCore Ahead of Market Recovery
- Here’s Why Pi Network Price Just Hit an All-Time Low
- Crypto Events to Watch This Week: Will the Market Recover or Crash More?
- XRP and BTC Price Prediction if Michael Saylor Dumps Bitcoin Following Crypto Market Crash
- Here’s Why MSTR Stock Price Could Explode in February 2026
- Bitcoin and XRP Price Prediction After U.S. Government Shuts Down


