Pepe Coin Price Prediction: Can EMA Golden Crossover Fuel a Rally to $0.000002?
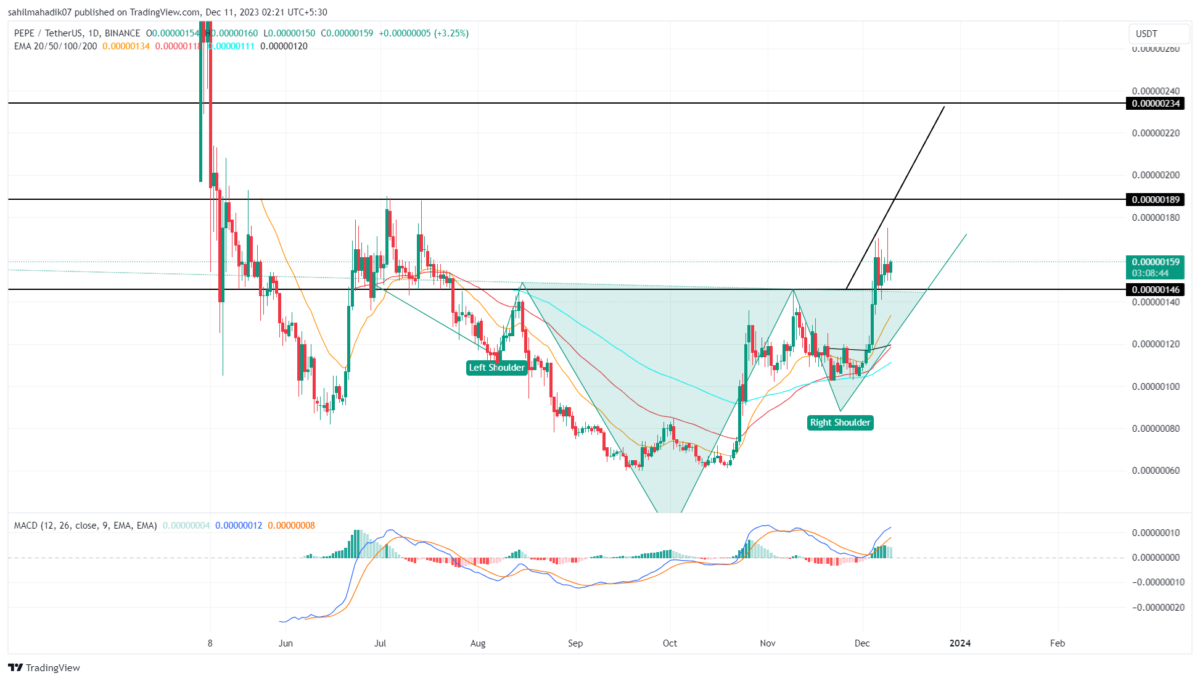
Pepe Coin Price Prediction: Over the past four months, the PEPE price traded sideways reflecting no initiation from buyers or sellers. However, a look at the technical chart revealed this consolidation as the formation of bullish reversal patterns called inverted head and shoulder patterns. A recent breakout from this pattern’s neckline has indicated the buyers are ready to take control.
Also Read: Bitcoin (BTC) “Past Performance is no Guarantee of Future Results” – VanEck
Bullish Pattern Sets $PEPE for Higher Recovery
- The rising PEPE price could face overhead support at $0.00000190 and $0.00000234
- The 50-day EMA slope continues to offer pullback support.
- The 24-hour trading volume in the Pepe coin is $149 Million, indicating a 39% loss.
On December 5th, the Pepe coin price recovery gave a decisive breakout from the neckline resistance of the inverted head and shoulder pattern. This breakout from this pattern has been an early sign of trend reversal and a long-position entry opportunity.
However, the post-breakout rally halts near the $0.0000017 mark, as the border market sentiment turns uncertain in response to Bitcoin price stalling in recovering momentum. Thus, Pepe is resonating in a narrow range between the aforementioned level and breached $0.0000146 support.
With the overall trend intact and the influence of a bullish breakout, the PEPE price is likely to resume the recovery trend. The post-breakout rally could surge the prices 48% higher to hit the $0.00000235 mark.
Is PEPE Price At a Risk of Major Correction?
While the overall outlook for Pepe coin price remains bullish, the current consolidation above $0.00000146 despite a breakout reflects weakness in buyers’ conviction. Usually, the breakout moves are rapid and fast-moving, and thus such a long consolidation would decrease the potential of recovery and a threat for downtrend contention. A breakdown below the $0.00000146 mark would invalidate the aforementioned bullish thesis.
- Exponential Moving Average: A potential golden crossover between the 50-and-200-day EMA could accelerate the buying momentum for higher growth.
- Moving Average Convergence Divergence: The MACD and a signal line above the zero line in a bullish crossover state reflect the bullish trend is z
Recent Posts
- Price Analysis
Binance Coin Price Risks Crash to $700 as Key BSC Metric Plunges 80%
Binance Coin price dropped by over 1% today, Dec. 29, as the crypto market remained…
- Price Analysis
SUI Price Forecast: What’s Next for SUI in 2026 After $78.9M Token Unlocks?
SUI price has spent recent sessions consolidating within a narrow range. The action reflect controlled…
- Price Analysis
Solana Price Prediction: How High Could SOL Go in January 2026?
Solana price showed signs of strength in early January 2026, hovering near $127 after a…
- Price Analysis
Top 3 Predictions for Bitcoin price, Ethereum price and XRP price for 2026 According to Analysts
Bitcoin price, Ethereum price, and XRP price show renewed strength heading into 2026 after daily…
- Price Analysis
Is $1 Dogecoin Price Technically Possible in 2026?
As the years draw to a close, Dogecoin trades above $0.12 amid a broader crypto…
- Price Analysis
Bitcoin Price Year-End Prediction: Analysts Highlight Key Levels Before 2025 Close
Bitcoin price hovered at $87,755 on December 28, 2025, as the year came to an…