

PEPE Price Prediction: 20% Rally in Sight If Buyer Breaks this Key Barrier


On August 29th, the crypto market witnessed a sudden surge in buying pressure as BTC price pumped to the federal court verdict favoring Greyscale investment over US SEC on Bitcoin ETF. As a result, the PEPE price showed another rebound attempt from $0.0000082 support to trigger a fresh recovery. Is this bounce enough to defy prevailing bearish sentiment?
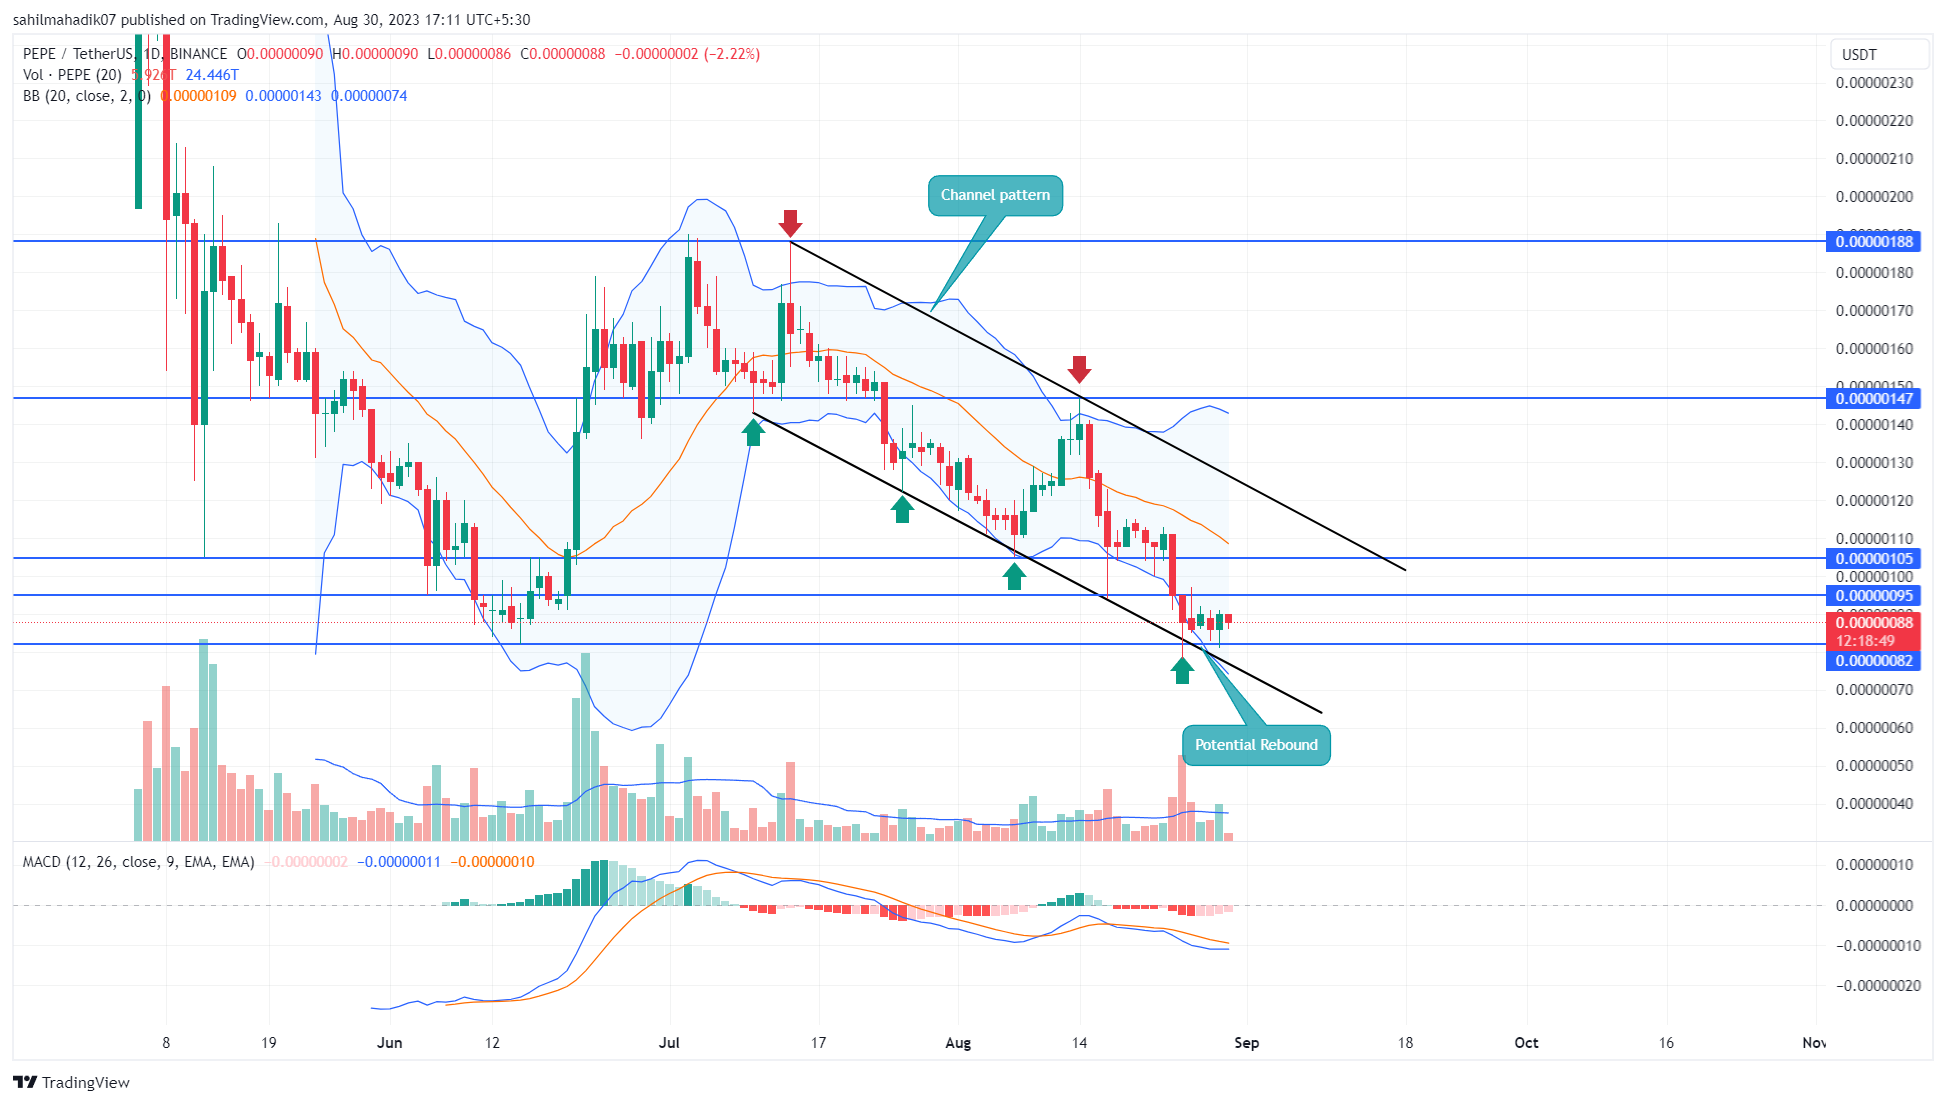
Pepe Coin Daily Chart: Key Points
- The Pepe coin price may continue sideways until the rectangle pattern is intact.
- A bullish breakout from $0.00000095 will set the prices for a 20% upswing
- The 24-hour trading volume in the Pepe coin is $130 Million, indicating a 92% gain.
 Source- Trading
The Pepe coin price has been trading sideways for the past five days reflecting no initiation from buyers or sellers for trend control. Interestingly this consolidation is confined within the range of August 17th candle($0.00000095 high and $0.00000075 low).
With the recent bounce mentioned above, the coin price trades within the rectangle range indicate the buyer would need more momentum to trigger a fresh recovery. By the press time, the PEPE price traded at $0.00000089 with an intraday loss of 1.11%.
If the bullish momentum rises, the buyers may breach the $0.00000095 resistance. The post-breakout rally would surge the prices 20% higher to hit the resistance trendline of the channel pattern.
Is PEPE Price Ready to Start New Recovery?
With the anticipated upswing, the PEPE price would hit the upper trendline of the channel pattern which in its history has offered significant supply pressure in the market. Therefore, until the channel pattern is intact, the short-term trendline of this memecoin will remain down.
A bullish breakout from the resistance trendline will signal a better confirmation of sustained recovery.
- Bollinger Band: The lower band of the Bollinger band indicator facing the downside reflects the bearish momentum is intact.
- Moving Average Convergence Divergence: A potential bullish crossover between the MACD(blue) and signal(orange) could offer an additional edge for a bullish recovery.

Why Trust CoinGape
CoinGape has covered the cryptocurrency industry since 2017, aiming to provide informative insights Read more…to our readers. Our journal analysts bring years of experience in market analysis and blockchain technology to ensure factual accuracy and balanced reporting. By following our Editorial Policy, our writers verify every source, fact-check each story, rely on reputable sources, and attribute quotes and media correctly. We also follow a rigorous Review Methodology when evaluating exchanges and tools. From emerging blockchain projects and coin launches to industry events and technical developments, we cover all facets of the digital asset space with unwavering commitment to timely, relevant information.
Premium Partners


Related Articles


- Shiba Inu Team Unveils ‘Shib Owes You’ Plan To Repay Plasma Bridge Hack Victims
- Fed Chair Race Tightens as Hassett’s Odds Slip Below 50% Ahead of Trump’s Decision
- Fed Injects $26 Billion: Will the Crypto Market Record a Year-End Rally?
- XRP Sell Pressure Intensifies amid Rising Inflows to Binance, South Korean Exchanges
- Crypto ETFs in 2026: What to Expect for Bitcoin, Ethereum, XRP, and Solana
- Binance Coin Price Risks Crash to $700 as Key BSC Metric Plunges 80%
- SUI Price Forecast: What’s Next for SUI in 2026 After $78.9M Token Unlocks?
- Solana Price Prediction: How High Could SOL Go in January 2026?
- Top 3 Predictions for Bitcoin price, Ethereum price and XRP price for 2026 According to Analysts
- Is $1 Dogecoin Price Technically Possible in 2026?
- Bitcoin Price Year-End Prediction: Analysts Highlight Key Levels Before 2025 Close


