PEPE Price Prediction: Double Bottom Pattern Sparks Hope for 40% Rally
Over the past five days, the Frog-themed memecoin has been hovering above the monthly support of $0.00000082. While the broader market uncertainty prevents the coin buyers from a significant rebound the lower price rejection in the daily candle reflects the rising demand pressure is intact. Here’s how a potential rebound from the aforementioned support could influence the future trend of PEPE price.
Also Read: Pepe Coin Team Gives Clarification Of The 16 Trillion Pepe Tokens Theft
Pepe Coin Daily Chart: Key Points
- A bullish breakout from the upper trendline could offer an early sign of trend reversal
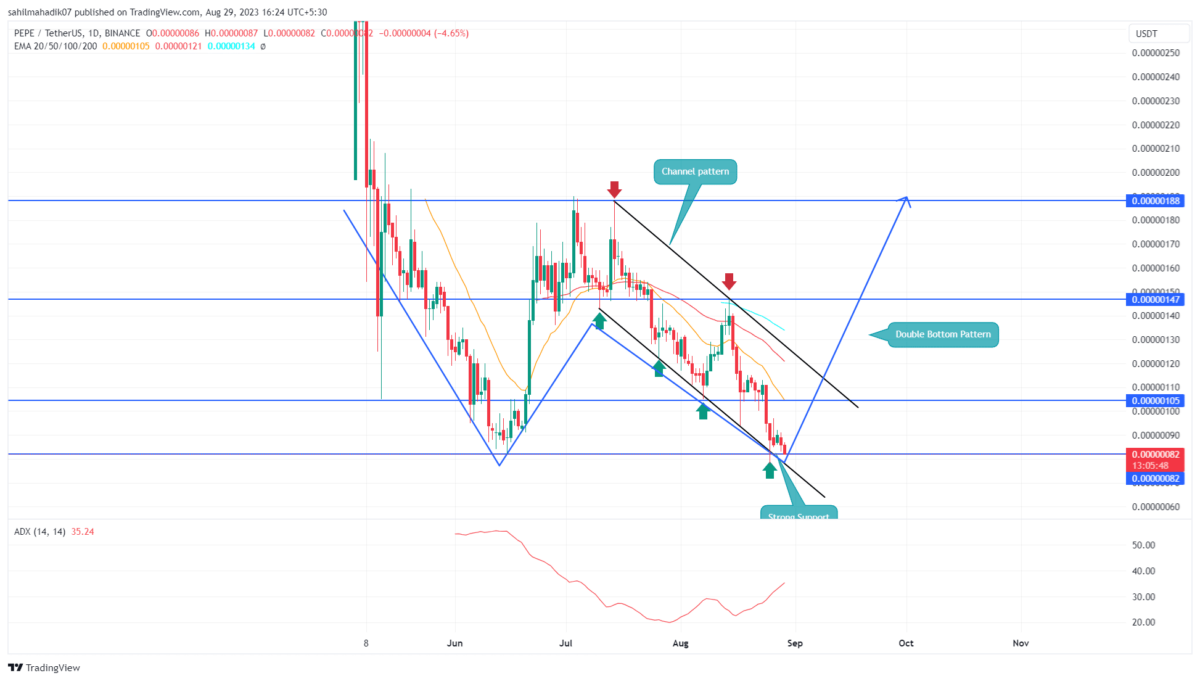
- The PEPE price may witness a high demand pressure at $0.00000082
- The 24-hour trading volume in the Pepe coin is $66.39 Million, indicating a 10% loss.
The Pepe coin price chart shows the ongoing correction is led by a downsloping channel. Along with the above-mentioned $0.00000082 support, the lower trendline of this pattern offers an additional push for a rebound.
In the past weeks, the PEPE price has rebounded from this trendline support multiple times, indicating the buyer’s active accumulation. The potential rebounded could raise the prices 40% higher to hit the upper trendline near $0.00000115.
However, the chart indicates this anticipated as the formation of a bullish reversal pattern called a double bottom. The chart pattern often spotted at the market bottom is a sign of increased accumulation.
Under the influence of this setup, the Pepe coin price may trigger a rally to $0.00000188.
Can the PEPE Price Rise Back to $0.0000015?
While the bullish outlook seems valuable for the PEPE price, the influence of the channel pattern is still aggressive on traders. Therefore, the investors looking for a safer entry should wait for a breakout above the resistance trendline as it may bolster buyers for the early target of $0.0000015.
On a contrary note, a bearish breakdown below the $0.00000082 or channel pattern may invalidate the bullish thesis
- Average Directional Index: The daily ADX at 35% reflects the ongoing correction in reaching maturity, bolstering the potential of a bullish reversal
- Exponential Moving Average: The downsloping EMAs(20, 50, and 100) could offer dynamic resistance in-market buyers.
Recent Posts
- Price Analysis
FUNToken Price Surges After MEXC Lists $FUN/USDC Pair
FUNToken, one of the most talked-about low-cap cryptos on the market with P2E undertones, has…
- Price Analysis
Bitcoin Price on Edge as $24B Options Expire on Boxing Day — Is $80K About to Crack?
Bitcoin enters the final stretch of the year with the price behavior signaling a decisive…
- Price Analysis
Crypto Market Rebounds: Are Bulls Positioning for a Santa Rally?
The crypto market showed signs of recovery on Christmas Day, gaining 0.67% in the…
- Price Analysis
XRP, Bitcoin, Ethereum Price Predictions Ahead of Jan 2026 CLARITY Act and US Crypto Reserve Plans
The XRP, Bitcoin, and Ethereum prices remained in a bear market after falling by over…
- Price Analysis
Pi Network Analysis: Pi Coin Price Surges on Christmas Eve, Can It Hit Year-End Highs?
Pi coin price reflect cautious positioning as market structure tightens near a key base. The…
- Price Analysis
Why Dec 26th Is A Do Or Die for Bitcoin Price Ahead Of Record Options Expiry?
As Christmas winds down, the Bitcoin price dipped 0.74% to around $86,750. Market participants…