PEPE Price Prediction: Key Resistance Breach Signals 20% Rally Ahead


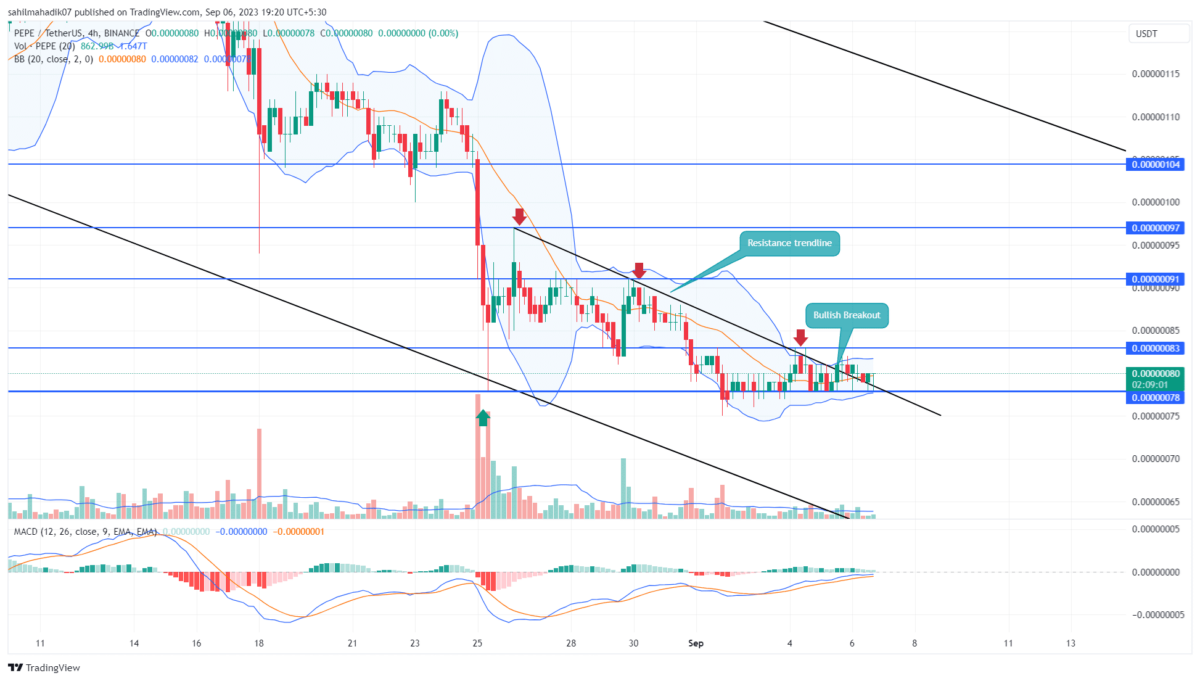
As bearish sentiment intensifies in the crypto market, Pepe coin price has experienced a sharp decline over the past two weeks. The daily chart indicates that this decline is reinforced by a descending resistance trendline that consistently opposes any recovery in price. However, a recent breakout from the barrier signals the potential for a bullish upswing.
Also Read: PEPE Price Prediction: Rising Demand Pressure Sets Pepe Coin Rally to $0.0000011
Trendline Breakout Triggers a Potential Upswing in PEPE Price
- An upswing breakout from the resistance trendline set the price 20% rally
- The Pepe coin downtrend will persist until the channel pattern is intact
- The 24-hour trading volume in the Pepe coin is $39 Million, indicating a 23% gain.
 Source- Trading
With the leading cryptocurrency Bitcoin, obtaining bullish support at the $25500 mark, the major crypto coins halted their correction. Similarly, the Pepe price rebounded from the $0.00000075 mark and breached overhead resistance on September 5th.
This breakout should provide buyers with a stepping stone to initiate the bullish upswing. As of now, the Pepe Coin price trades at $0.00000079 mark with an intraday loss of 1.23%. The downtick is retesting the breached trendline to check its viability for suitable support.
If the buyers manage to sustain this level, the post-breakout rally could soar the prices to a potential target of $0.00000083, followed by $0.00000091 or $0.00000097.
Channel Pattern Could Prolong the Downward Trend
A bullish break past the resistance trendline could potentially propel the memecoin by 20% or higher targeting the $0.0000097 mark. While this expected rise is set to bolster market recovery sentiments, a keen long in the daily chart shows this upswing is confined with the range of falling channel pattern. The rising price may face intense supply pressure at the overhead trendline.
- Moving Average Convergence Divergence: Despite the falling prices, the MACD(blue) and signal(orange) rising indicate the buying pressure of bottom supports is rising.
- Bollinger Band: The narrow Bollinger Band indicator indicates the market participants.
Why Trust CoinGape
CoinGape has covered the cryptocurrency industry since 2017, aiming to provide informative insights Read more…to our readers. Our journal analysts bring years of experience in market analysis and blockchain technology to ensure factual accuracy and balanced reporting. By following our Editorial Policy, our writers verify every source, fact-check each story, rely on reputable sources, and attribute quotes and media correctly. We also follow a rigorous Review Methodology when evaluating exchanges and tools. From emerging blockchain projects and coin launches to industry events and technical developments, we cover all facets of the digital asset space with unwavering commitment to timely, relevant information.
Related Articles


- CLARITY Act Failure Could Stall the 2026 Crypto Bull Run, Warns Bitwise CIO
- BTC Price May Rally if Fed Prints Money to Stabilize Japan, Says Arthur Hayes
- Trump Says Interest Rates Will Come Down Once Fed Chair Is Replaced
- Why Monad Token Price is Up Today?
- Strategic Bitcoin Reserve: South Dakota Introduces Bill to Invest in BTC as U.S. States Explore Crypto
- Shiba Inu Price Outlook As SHIB Burn Rate Explodes 2800% in 24 Hours
- Pi Network Price Prediction as 134M Token Unlock in Jan 2026 Could Mark a New All-Time Low
- Bitcoin Price Outlook as US Dollar Index Hits 4-Year Low, Gold Soars
- Stock Market Today: Nasdaq, Dow, S&P 500 Futures Rise Ahead of Fed Meeting, and Jobless Claims
- Bitcoin And XRP Price Prediction Ahead of FOMC Meeting Today, Jan 28
- XRP Price Prediction as Ripple Scores Big Partnership in Cash-Rich Saudi Arabia


