PEPE Price Prediction: Will Buyers Defend $0.00000075 Support in Current Market FUD?


Over the past week, Pepe Coin price action has been marked by indecision. Its largely sideways movement, punctuated by short-bodied candles and pronounced wick rejections at both ends, underscores a market waiting for cues. This drawn-out consolidation phase, as highlighted in our previous article, has given rise to a bearish pennant pattern. Typically, this formation suggests a potential continuation of the preceding downtrend.
Also Read: PEPE Price Prediction: Bearish Flag in $PEPE Chart Signal a 10% Downturn
Breakdown from Support Trendline Sets Pepe Price for 11% Drop
- The Pepe price may consolidate longer before a decisive breakdown.
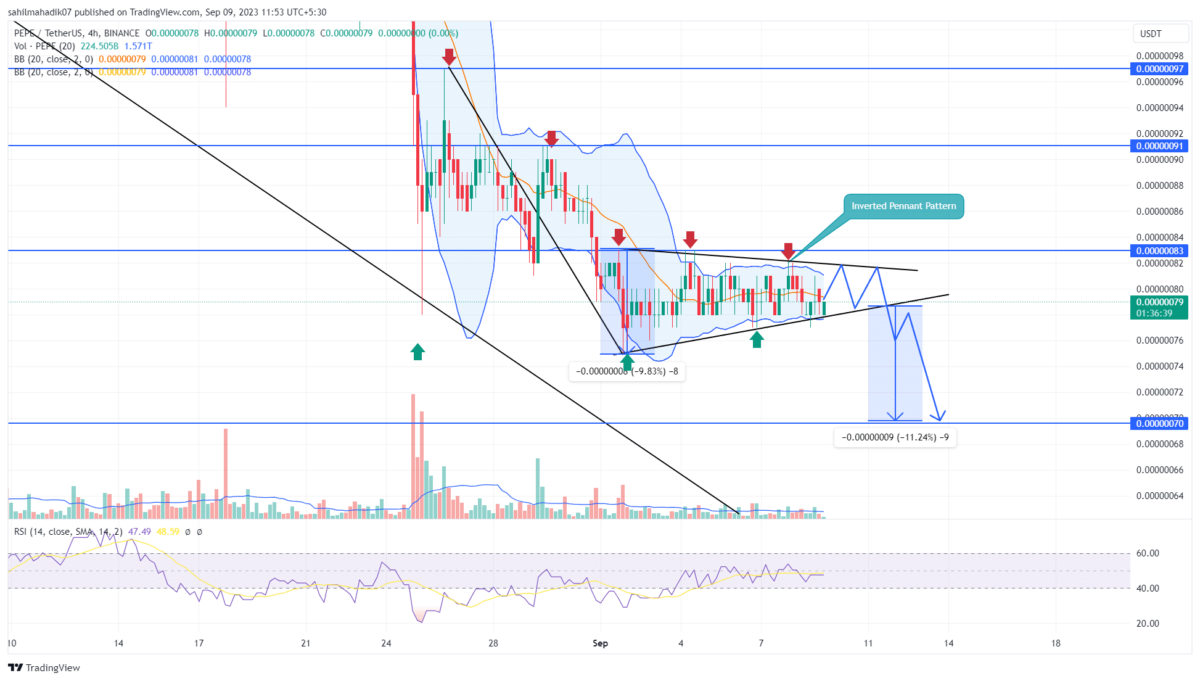
- The coin price trading below the 4-hour chart EMAs(20, 50, 100, and 200) indicates a downtrend is active.
- The 24-hour trading volume in the Pepe coin is $34 Million, indicating an 18% loss.
 Source- Tradingview
At the time of writing, Pepe Coin is priced at $0.000000788. Today’s movement sees it recording a modest 1.25% downtick, bouncing back to the pennant’s lower boundary. This downtick might indicate a persistence of the current consolidation, at least for a few more trading sessions.
Yet, with the price steadily approaching the apex of the pennant, a decisive breakout – or breakdown – is looming on the horizon. Many analysts may towards a bearish outcome for PepeCoin, given the pattern’s traditional implications.
Should the price breach the pennant’s lower trendline, it would signify a resurgence of bearish sentiment. In such a scenario, we might see Pepe Coin slide by approximately 11%, breaking below the $0.00000075 support to hit $0.00000070.
Can Pepe Price Rise Back to $0.00000091?
While a bearish outcome seems more probable, it’s not set in stone. For those seeking a safer entry point, it might be prudent to await a confirmed breakout from the pennant. The space between the pattern’s converging trendlines represents a ‘no trading zone’ for many. A decisive break above the pennant could negate the bearish outlook, propelling Pepe Coin towards the $0.00000091 mark.
- Relative Strength Index: Despite a rising RSI, the price action making a lower high indicates the buyers’ attempts to recover are getting undermined.
- Bollinger Band: The sideways track of Bollinger Band indicators reflects an increasing market volatility.

Why Trust CoinGape
CoinGape has covered the cryptocurrency industry since 2017, aiming to provide informative insights Read more…to our readers. Our journal analysts bring years of experience in market analysis and blockchain technology to ensure factual accuracy and balanced reporting. By following our Editorial Policy, our writers verify every source, fact-check each story, rely on reputable sources, and attribute quotes and media correctly. We also follow a rigorous Review Methodology when evaluating exchanges and tools. From emerging blockchain projects and coin launches to industry events and technical developments, we cover all facets of the digital asset space with unwavering commitment to timely, relevant information.
Related Articles


- CLARITY Act Progress Under Threat As U.S. Shutdown Deadline Nears
- Breaking: Crypto Wallet Firm Ledger Eyes US IPO at $4B Valuation
- U.S. Crypto Regulation Advances as SEC and CFTC Announce Harmonization Talks
- CZ’s YZi Labs Joins BitGo IPO as Strategic Investor After Strong NYSE Debut
- Crypto Market Stabilizes as BOJ Keeps Rates Unchanged amid Slowing Inflation
- Dogecoin Price Prediction as 21Shares Announces DOGE ETF
- GME Stock Price Outlook as CEO Ryan Cohen Buys Shares Amid Store Closures
- Bitcoin Price Outlook as US Senate Delays CLARITY Act Again
- Ethereum Price Prediction as Trump Signals Crypto Market Bill Signing soon
- Bitcoin Price Prediction Ahead of Key US Inflation and GDP Data
- XRP Price Forecast as Binance Officially Lists Ripples’s $RLUSD Stablecoin


