Pepecoin Price Analysis: Ending Diagonal Pattern Points to a 25.5% Rally


Pepepcoin Price Analysis: Amid the ongoing correction in the Frog-themed cryptocurrency PEPE, the coin price is shaped into a falling wedge pattern or also known as an ending diagonal pattern. The converging trendline of this pattern, where the support trendline is less inclined indicates the weakening bearish momentum. Here’s how a bullish breakout from this pattern leads to a potential rally in Pepecoin.
Also Read: Pepecoin Price Rally to $0.0000015? Chart Pattern Signals End of Correction
Pepecoin Price Daily Chart
- An upside breakout from the wedge pattern could set the PEPE price for a 25.5% rally
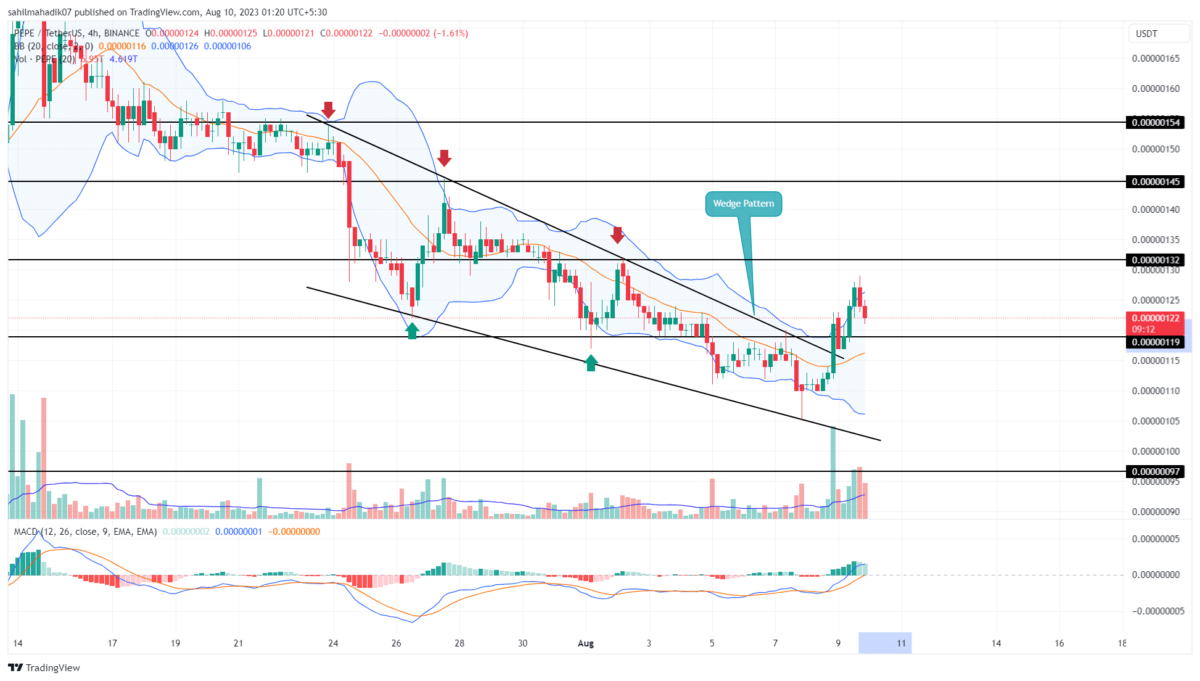
- The MACD indicator slope above the midline could offer additional confirmation for the price rally.
- The 24-hour trading volume in the Pepecoin coin is $59.9 Million, indicating a 47.5 % loss.
 Source- Tradingview
The formation of the ending diagonal pattern is often a sign of trend maturity and triggers a significant counter-trend move. After spending nearly two weeks within the pattern the Pepe price gave a bullish breakout from its upper resistance on August 8th.
This breakout back by increased volume indicates the conviction of buyers to lead a higher recovery. So far the post reset really has such a coin price of 4.86% to reach the current trading price of $0.0000012
Completion of this chart pattern leads to a rally back to where it started. Therefore, With sustained buying the PEPE price is likely to be 25.5% higher to hit $0.00000154.
What are the Potential Targets for PEPE Price Rally.?
After a significant breakout of the pattern’s resistance trendline, the market participants can expect each swing high as a potential target. Thus, the post-breakout rally could hit $0.00000132, followed by $0.00000145, and $0.00000154.
- Bollinger Band: An uptick in the upper ceiling of the Bollinger Band indicator reflects the police momentum is aggressive.
- Moving average convergence divergence: a positive crossover state between the MACD(blue) and signal(Orange) line indicates the short term has turned bullish.
Why Trust CoinGape
CoinGape has covered the cryptocurrency industry since 2017, aiming to provide informative insights Read more…to our readers. Our journal analysts bring years of experience in market analysis and blockchain technology to ensure factual accuracy and balanced reporting. By following our Editorial Policy, our writers verify every source, fact-check each story, rely on reputable sources, and attribute quotes and media correctly. We also follow a rigorous Review Methodology when evaluating exchanges and tools. From emerging blockchain projects and coin launches to industry events and technical developments, we cover all facets of the digital asset space with unwavering commitment to timely, relevant information.
Related Articles


- CLARITY Act Failure Could Stall the 2026 Crypto Bull Run, Warns Bitwise CIO
- BTC Price May Rally if Fed Prints Money to Stabilize Japan, Says Arthur Hayes
- Trump Says Interest Rates Will Come Down Once Fed Chair Is Replaced
- Why Monad Token Price is Up Today?
- Strategic Bitcoin Reserve: South Dakota Introduces Bill to Invest in BTC as U.S. States Explore Crypto
- Shiba Inu Price Outlook As SHIB Burn Rate Explodes 2800% in 24 Hours
- Pi Network Price Prediction as 134M Token Unlock in Jan 2026 Could Mark a New All-Time Low
- Bitcoin Price Outlook as US Dollar Index Hits 4-Year Low, Gold Soars
- Stock Market Today: Nasdaq, Dow, S&P 500 Futures Rise Ahead of Fed Meeting, and Jobless Claims
- Bitcoin And XRP Price Prediction Ahead of FOMC Meeting Today, Jan 28
- XRP Price Prediction as Ripple Scores Big Partnership in Cash-Rich Saudi Arabia


