Pepecoin Price Analysis: How Far Will the Retracement Take $PEPE Price?
Pepepcoin Price Analysis: While the market leaders, Bitcoin and Ethereum price showed a halt in their recovery rally, the Frog-themed Memecoin Pepe entered a minor correction phase after hitting the $0.0000019 barrier. This retracement seems reasonable as the buyers would need a break after significant growth in the latter part of June. However, will PEPE price continue to uptrend after this correction?
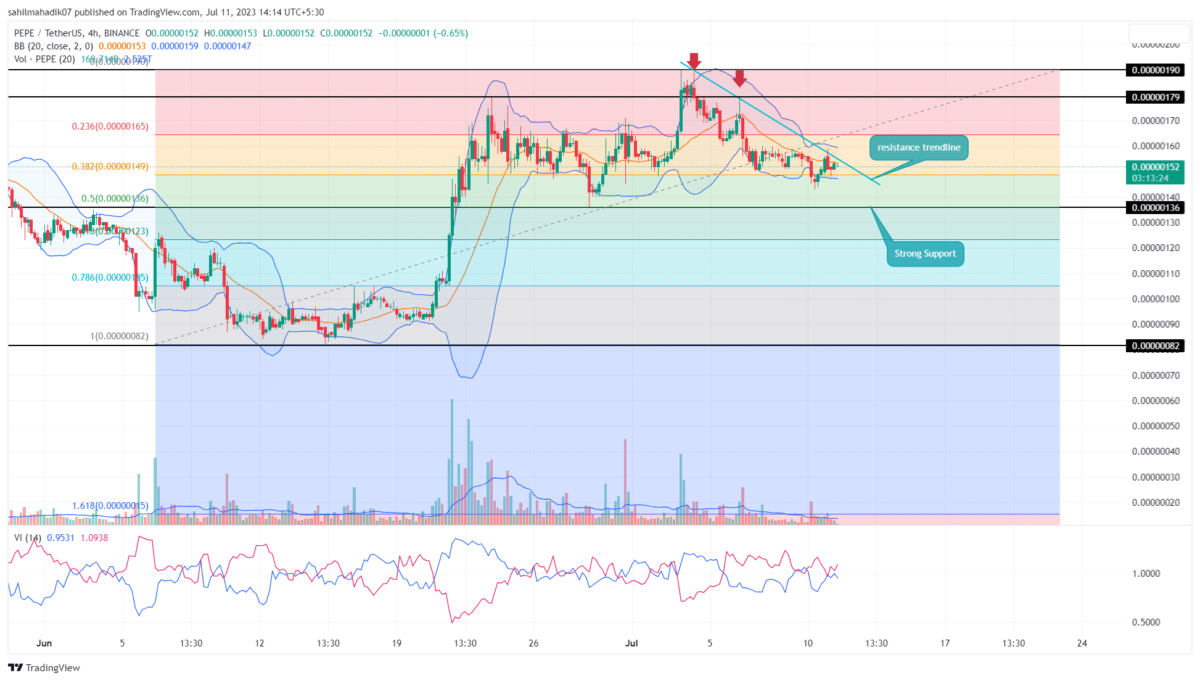
Pepecoin Price Daily Chart
- The $0.00000136 support stands as a crucial support of the PEPE price.
- A breakout above the overhead trendline will reignite the bullish momentum.
- The 24-hour trading volume in the Pepecoin coin is $114.5 Million, indicating a 56 % gain.
Over the week, the PEPE price has tumbled around 24.6% from $0.0000019 and reached today’s low of $0.00000143. This correction phase is currently carried by a downsloping trendline acting as a dynamic resistance to pressurize buyers.
By press time, this memecoin trades at $0.0000015 and shows long-tail rejection at 38.2% Fibonacci retracement level. Thus, demand pressure could trigger another bounce to the overhead trendline and replenish the selling momentum.
With sustained buying, the PEPE price could tumble another 8% and retest the strong demand zone of $0.00000136 in confluence with 50% FIB. This level is crucial for buyers as losing the last swing low would indicate notable weakness in bullish momentum.
Will Pepecoin Coin Strike the 0.0000019 Barrier?
The falling Pepecoin price backed by reducing volume indicates the current correction is temporary. Therefore, interested traders looking for a long entry opportunity must wait for a breakout above the overhead trendline. This breakout will signal the resumption of a bullish recovery and the possibility to surpass the $0.0000019 mark.
- Bollinger Band: The lower band of the Bollinger Band indicator at $0.0000019 increases the support power of this level.
- Vortex indicator: A bearish crossover between the VI+(Blue) and VI-(orange) reflects the increasing selling momentum in price.
Recent Posts
- Price Analysis
XRP Price Prediction: Will 4 Billion Transactions Spark Next Rally?
XRP price trades below the $2 mark after the latest correction across the broader cryptocurrency…
- Price Analysis
Solana Price Outlook: Will SOL Recover With Strong Institutional Buying?
Solana price remains steady above the $120 support after the recent crypto market pullback. The…
- Price Analysis
Ethereum Price Risks Crash to $2,500 Amid Sustained Wintermute Dumping
Ethereum price dropped below the key support at $3,000 on Tuesday, down by ~40% from…
- Price Analysis
Is It Time to Sell Bitcoin for Gold- Analyst Spots 2023 Pattern That Triggered BTC’s Last Major Rally
The Stock Market rose modestly as crypto market consolidation sparked a fresh Bitcoin vs Gold…
- Price Analysis
Bitcoin Price Prediction and Analysis: Will BTC Hit $100k Before Year-End?
Bitcoin price moves into the final trading sessions with uncertainty around upside continuation. BTC price…
- Price Analysis
Bitcoin Price Prediction As Michael Saylor Pauses BTC Purchase- Is A Fall to $74k Imminent?
Michael Saylor's Strategy has paused additional BTC purchases while increasing cash reserves, prompting renewed speculation…