Pepe Coin Price Analysis: $PEPE Price See 10% Jump Above this Barrier
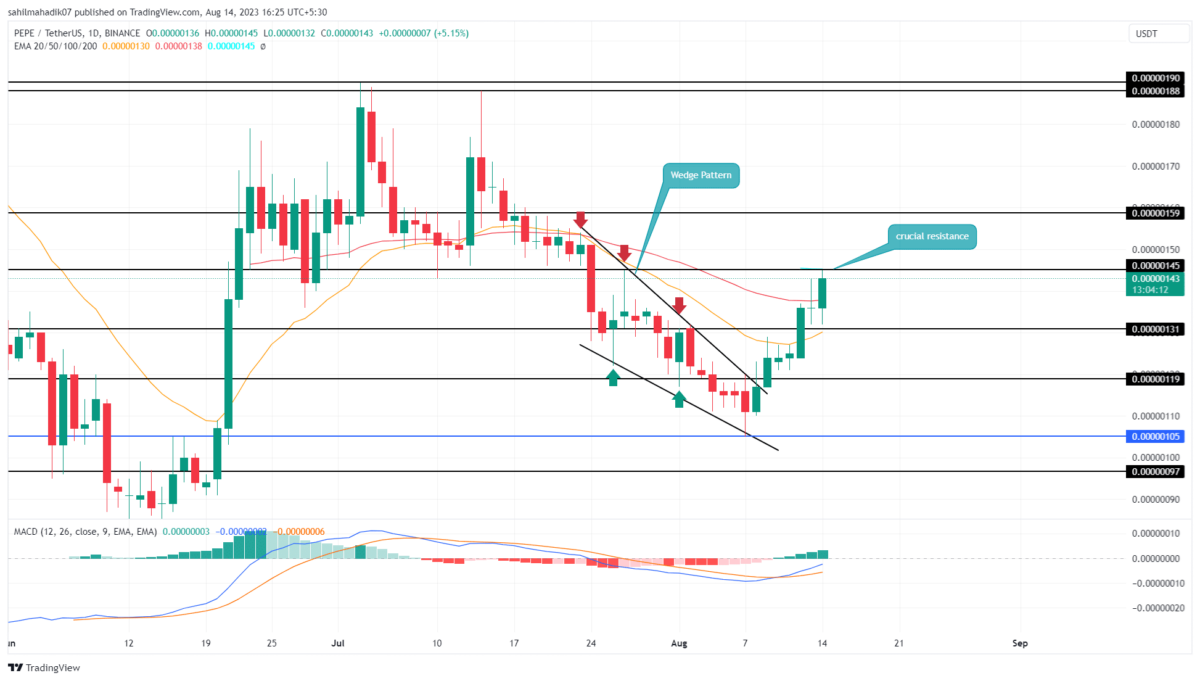
Pepepcoin Price Analysis: On August 8th, the Pepecoin price gave a bullish breakout from the resistance trendline of a falling wedge pattern. This pattern completion signals a trend reversal and triggers a V-shaped recovery in the daily time frame chart. Amid the seven days rally, the prices recorded 30% growth reaching the current price of $0.00000143. Will this recovery extend?
Also Read: Will Pepe Coin (PEPE) Price Reclaim $0.00000155 Milestone?
Pepecoin Price Daily Chart
- A bullish breakout from the $0.00000154 resistance set the PEPE price for a 10% rally
- The coin price reclaimed the 4-hour EMAs(20 and 50) could offer additional support to rising prices.
- The 24-hour trading volume in the Pepecoin coin is $107.5 Million, indicating a 42.5 % loss.
A V-shaped recovery signals aggressive buying and an attempt from bulls to reclaim trend control. So far the PEPE price rally has reclaimed two significant horizontal resistance of $0.00000120, and $0.00000131.
With an intraday gain of 5.15%, the coin buyers rechallenge the combined resistance of $0.0000145 and 50% Fibonacci retracement level. However, after a sudden rally, the frog-themed memecoin could show a minor retracement to absorb the build-up selling pressure.
If the bullish momentum persists, the crypto buyers could give a breakout from the 0.5 FIB level. Reclaiming this barrier will serve as a crucial signal as buyers have offset 50% region control of the seller.
The post-breakout rally would trigger a quick 10% to $0.0000016.
Can Pepecoin Price Still Resume Downward Trend?
If the anticipated reversal plunged below $0.00000131, the coin holders would still be under the threat of a downtrend continuation. This breakdown may catalyze a 9.5% drop to test the immediate support of $0.0000012.
- Exponential Moving Average: The 100-day EMA at $0.00000145 increases the resistance power of this barrier.
- Moving Average Convergence Divergence: The increasing gap between the MACD(blue) and signal(orange) reflects rising bullish momentum in the market.
Recent Posts
- Price Analysis
Pi Coin Price Prediction as Expert Warns Bitcoin May Hit $70k After BoJ Rate Hike
Pi Coin price rose by 1.05% today, Dec. 18, mirroring the performance of Bitcoin and…
- Price Analysis
Cardano Price Outlook: Will the NIGHT Token Demand Surge Trigger a Rebound?
Cardano price has entered a decisive phase as NIGHT token liquidity rotation intersects with structural…
- Price Analysis
Will Bitcoin Price Crash to $74K as Japan Eyes Rate Hike on December 19?
Bitcoin price continues to weaken after breaking below its recent consolidation range, now trading within…
- Price Analysis
Bitwise Predicts Solana Price Will Hit New All-Time Highs in 2026
Solana price declined by 4% over the past 24 hours, breaking below the key $130…
- Price Analysis
Bitcoin Price Outlook: Capriole Founder Warns of a Drop Below $50K by 2028
Bitcoin price narratives continue to evolve as long-term downside risks regain attention. Bitcoin price discussions…
- Price Analysis
XRP Price Rare Pattern Points to a Surge to $3 as ETFs Cross $1B Milestone
XRP price dropped by 1.2% today, Dec. 17, continuing a downward trend that started in…