Pepecoin Price Analysis: $PEPE Price See 15% Upswing in Early June; But There’s a Catch


Pepepcoin Price Analysis: On May 30th, the Pepecoin price gave a decisive breakdown from the support trendline of the inverted pennant pattern, projecting the memecoin is poised for a significant downfall. As of now, the coin price trades at $0.00000127 and is likely to retest the breached support as potential resistance to validate price sustainability at lower levels. Here’s how this pattern could affect the potential trend for PEPE.
Also Read: Pepecoin Price Analysis: Will $PEPE Price Lose $0.000001 Support this Week?
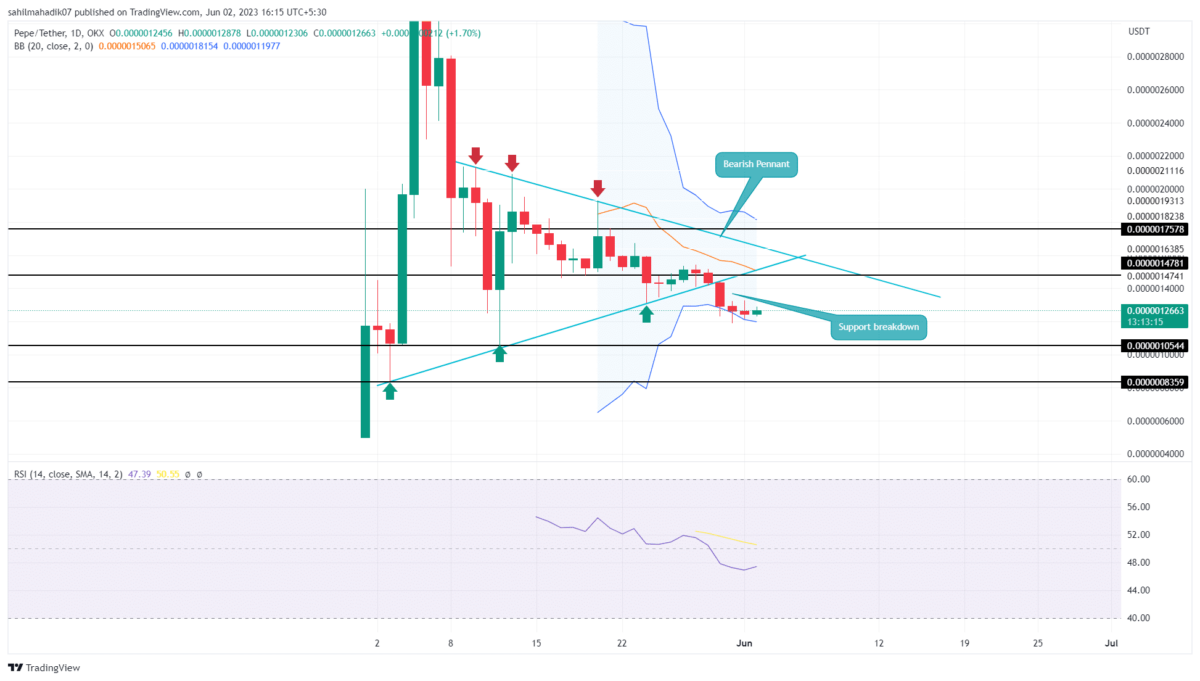
PEPE Price Daily Chart
- A bearish pennant pattern could intensify the underlying momentum for a temporary break of the sideways trend.
- The midline of the Bollinger band indicator may act as a dynamic resistance for falling PEPE price
- The 24-hour trading volume in the Pepecoin coin is $118.5 Million, indicating a 12.5% loss.
 Source-Tradingview
In the last three days, the PEPE price has shown short body candles above the $0.0000012 mark indicating some weakness in the bearish momentum. Thus, any positive impact from the broader market sentient will trigger an upswing in the coin to retest the pierced support.
This bullish upswing will face the next significant supply zone at the combined resistance of the overhead trendline and $0.00000147 mark, suggesting a potential rally of 15%.
If sellers defenced the newly reclaimed resistance, the post-breakdown fall could tumble 16% to hit the $0.000001042 mark, followed by $0.000000835.
Conversely, a breakout above the rising trendline will invalidate the bearish thesis.
Will Pepecoin Price Hit $0.000001?
A bearish breakdown of the three weeks consolidation phase has set the PEPE price for a considerable downtrend. However, to evaluate sellers’ conviction, a retest to the overhead trendline could replenish the selling momentum. The possible downfall is likely to tag the triangle structure’s lowest swing low, which is around $0.00000835.
- Bollinger Band: The downsloping lower band of the BB indicator reflects the selling momentum intact.
- Relative Strength Index: The daily RSI slope below the midline projects the negative trend sentiment.

Why Trust CoinGape
CoinGape has covered the cryptocurrency industry since 2017, aiming to provide informative insights Read more…to our readers. Our journal analysts bring years of experience in market analysis and blockchain technology to ensure factual accuracy and balanced reporting. By following our Editorial Policy, our writers verify every source, fact-check each story, rely on reputable sources, and attribute quotes and media correctly. We also follow a rigorous Review Methodology when evaluating exchanges and tools. From emerging blockchain projects and coin launches to industry events and technical developments, we cover all facets of the digital asset space with unwavering commitment to timely, relevant information.

Related Articles


- Senators Make Amendments To CLARITY Act On Yield and DeFi Ahead Of Crypto Bill’s Markup
- Breaking: U.S. November PPI Inflation Rises To 3%, Bitcoin Climbs Above $95k
- Universal Exchange Bitget Taps Football Culture to Promote a One-Stop Crypto Trading Experience
- Aster DEX Review – Is It Safe and Legitimate?
- XRP News: Ripple Secures First EMI License in Luxembourg to Boost Payments in Europe
- Ethereum Price Prediction as Network Activity Hits ATH Ahead of CLARITY Markup
- Robinhood Stock Price Prediction: How High Could HOOD Go Technically in 2026?
- Cardano Price Prediction as Germany’s DZ Bank Gets MiCAR Approval for Cardano Trading
- Meme Coins Price Prediction: What’s Next for Pepe Coin, Dogecoin, and Shiba Inu Amid Market Rally?
- Standard Chartered Predicts Ethereum Price could reach $40,000 by 2030
- Bitcoin Price Eyes $100k as Core US Inflation Slips Ahead of CLARITY Act Markup


