Pepecoin Price Analysis: $PEPE Price See 15% Upswing in Early June; But There’s a Catch
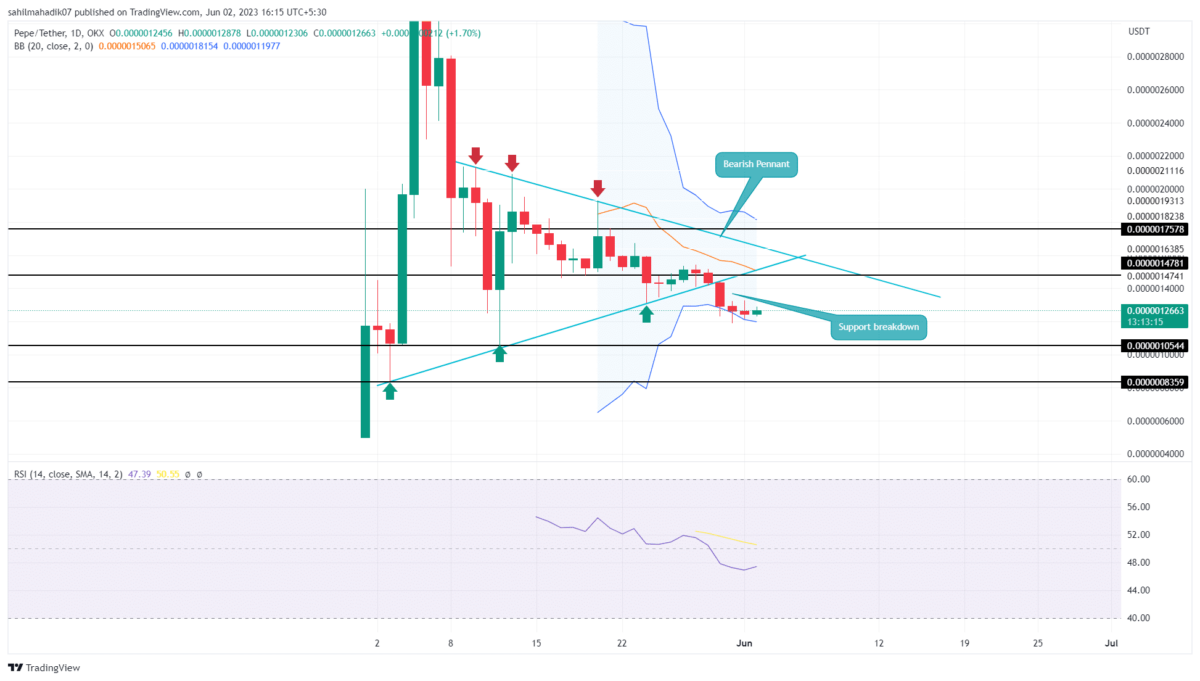
Pepepcoin Price Analysis: On May 30th, the Pepecoin price gave a decisive breakdown from the support trendline of the inverted pennant pattern, projecting the memecoin is poised for a significant downfall. As of now, the coin price trades at $0.00000127 and is likely to retest the breached support as potential resistance to validate price sustainability at lower levels. Here’s how this pattern could affect the potential trend for PEPE.
Also Read: Pepecoin Price Analysis: Will $PEPE Price Lose $0.000001 Support this Week?
PEPE Price Daily Chart
- A bearish pennant pattern could intensify the underlying momentum for a temporary break of the sideways trend.
- The midline of the Bollinger band indicator may act as a dynamic resistance for falling PEPE price
- The 24-hour trading volume in the Pepecoin coin is $118.5 Million, indicating a 12.5% loss.
In the last three days, the PEPE price has shown short body candles above the $0.0000012 mark indicating some weakness in the bearish momentum. Thus, any positive impact from the broader market sentient will trigger an upswing in the coin to retest the pierced support.
This bullish upswing will face the next significant supply zone at the combined resistance of the overhead trendline and $0.00000147 mark, suggesting a potential rally of 15%.
If sellers defenced the newly reclaimed resistance, the post-breakdown fall could tumble 16% to hit the $0.000001042 mark, followed by $0.000000835.
Conversely, a breakout above the rising trendline will invalidate the bearish thesis.
Will Pepecoin Price Hit $0.000001?
A bearish breakdown of the three weeks consolidation phase has set the PEPE price for a considerable downtrend. However, to evaluate sellers’ conviction, a retest to the overhead trendline could replenish the selling momentum. The possible downfall is likely to tag the triangle structure’s lowest swing low, which is around $0.00000835.
- Bollinger Band: The downsloping lower band of the BB indicator reflects the selling momentum intact.
- Relative Strength Index: The daily RSI slope below the midline projects the negative trend sentiment.
Recent Posts
- Price Analysis
Pi Coin Price Prediction as Expert Warns Bitcoin May Hit $70k After BoJ Rate Hike
Pi Coin price rose by 1.05% today, Dec. 18, mirroring the performance of Bitcoin and…
- Price Analysis
Cardano Price Outlook: Will the NIGHT Token Demand Surge Trigger a Rebound?
Cardano price has entered a decisive phase as NIGHT token liquidity rotation intersects with structural…
- Price Analysis
Will Bitcoin Price Crash to $74K as Japan Eyes Rate Hike on December 19?
Bitcoin price continues to weaken after breaking below its recent consolidation range, now trading within…
- Price Analysis
Bitwise Predicts Solana Price Will Hit New All-Time Highs in 2026
Solana price declined by 4% over the past 24 hours, breaking below the key $130…
- Price Analysis
Bitcoin Price Outlook: Capriole Founder Warns of a Drop Below $50K by 2028
Bitcoin price narratives continue to evolve as long-term downside risks regain attention. Bitcoin price discussions…
- Price Analysis
XRP Price Rare Pattern Points to a Surge to $3 as ETFs Cross $1B Milestone
XRP price dropped by 1.2% today, Dec. 17, continuing a downward trend that started in…