Pi Network Price Coils Up as Triple Bottom Pattern Hints at 35% Surge


Highlights
- Pi Network price may be ripe for a surge as volatility dries.
- The Bollinger Bands and Average True Range (ATR) point to a strong surge.
- Pi coin price has formed a triple-bottom pattern on the eight-hour chart.
Pi Network price is down 2.35% this month as it hovers around $0.64, a crucial support level. Technical analysis showcases a triple-bottom pattern that hints at an explosive, double-digit Pi Coin rally to key resistance levels.
Pi Network Price Coils Up as Volatility Declines
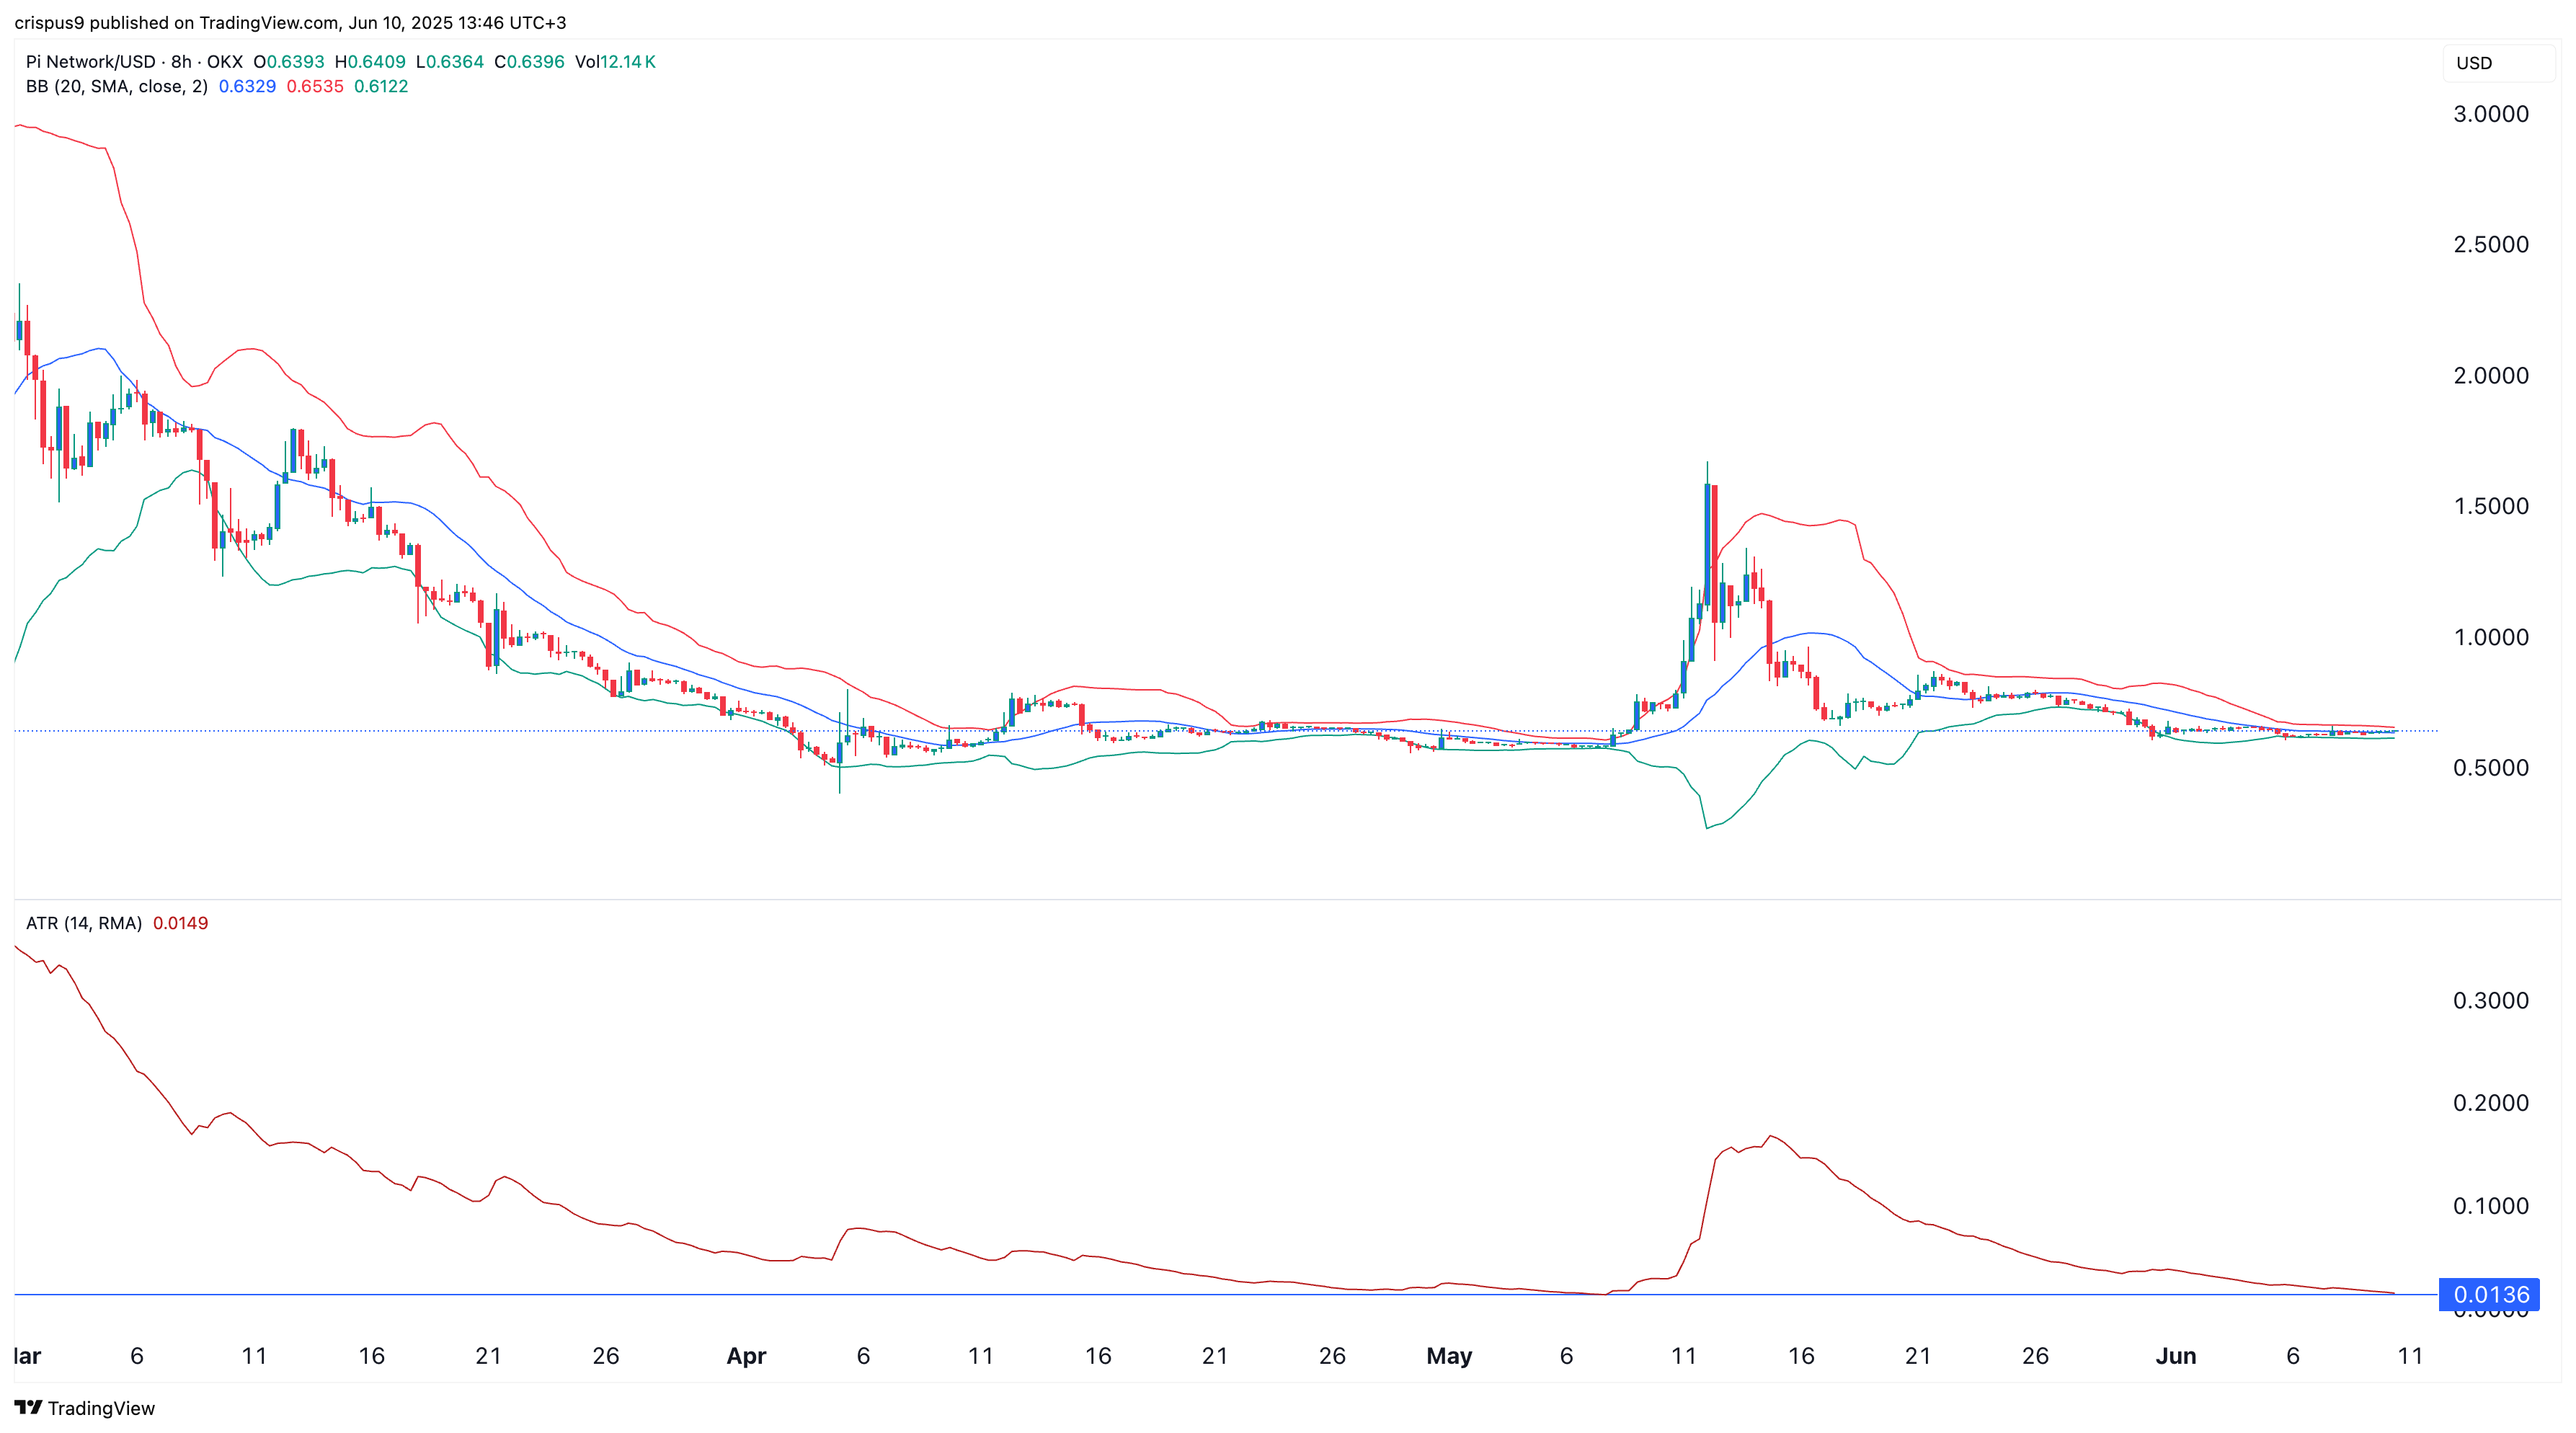
The Bollinger Bands have enveloped the Pi Network price over the past few weeks, showcasing a decline in volatility. Explosive breakouts often occur after an asset coils up, aka, when volatility dies down.
A similar constriction of the Bollinger Bands was noted between mid-April and May 2025. Following this decline in volatility, the 8-hour Pi Network price experienced an exponential move to the upside, resulting in triple-digit gains.
Another popular volatility indicator is the Average True Range (ATR). It measures volatility by calculating the average range of price movement in a specified duration. The ATR indicator has dropped to 0.0136, its lowest point since May 7, confirming that volatility has decreased.
While the volatility indicators hint at an explosive breakout, the direction remains unclear. Technical analysis suggests a triple-bottom pattern, which forecasts a bullish resolution. Additionally, the ongoing CEX outflows point to an eventual rebound for the Pi Network price. Blockchain data from PiScan indicates that over 72,720 Pi coins were withdrawn from exchanges in the last 24 hours, marking the end of the recent inflow spree and painting a bullish picture for PI.
Triple Bottom Pattern Emerges for Pi Coin
As noted above, the Pi Network price has formed a triple-bottom pattern on the eight-hour chart. This pattern comprises three distinct bottoms. The peaks of these swing lows can be connected to form a neckline, a key resistance level. A breakout above the neckline will confirm a breakout.
The Relative Strength Index (RSI) and the MACD indicators are flashing a buy signal due to the bullish divergence. This setup occurs when the momentum oscillators are forming higher lows while Pi Network price forms lower lows. It shows that the momentum is rising, but the price is not reflecting this strength. A resolution of this divergence leads to a reversal of the ongoing trend.
Hence, the bullish divergence adds credence to a bullish breakout. The theoretical target of $2.74 for this triple bottom pattern is calculated by adding the height of the pattern to the neckline at $1.67.
However, the uptrend to $1.67 is not easy as Pi Coin price may face hurdles at $0.8600, the highest swing point formed on May 21. After this, the altcoin will face the psychological level at $1, followed by $1.6715, the highest point in May. A move beyond these resistance levels will signal further gains, leading to the triple-bottom setup’s forecasted target at $2.74.
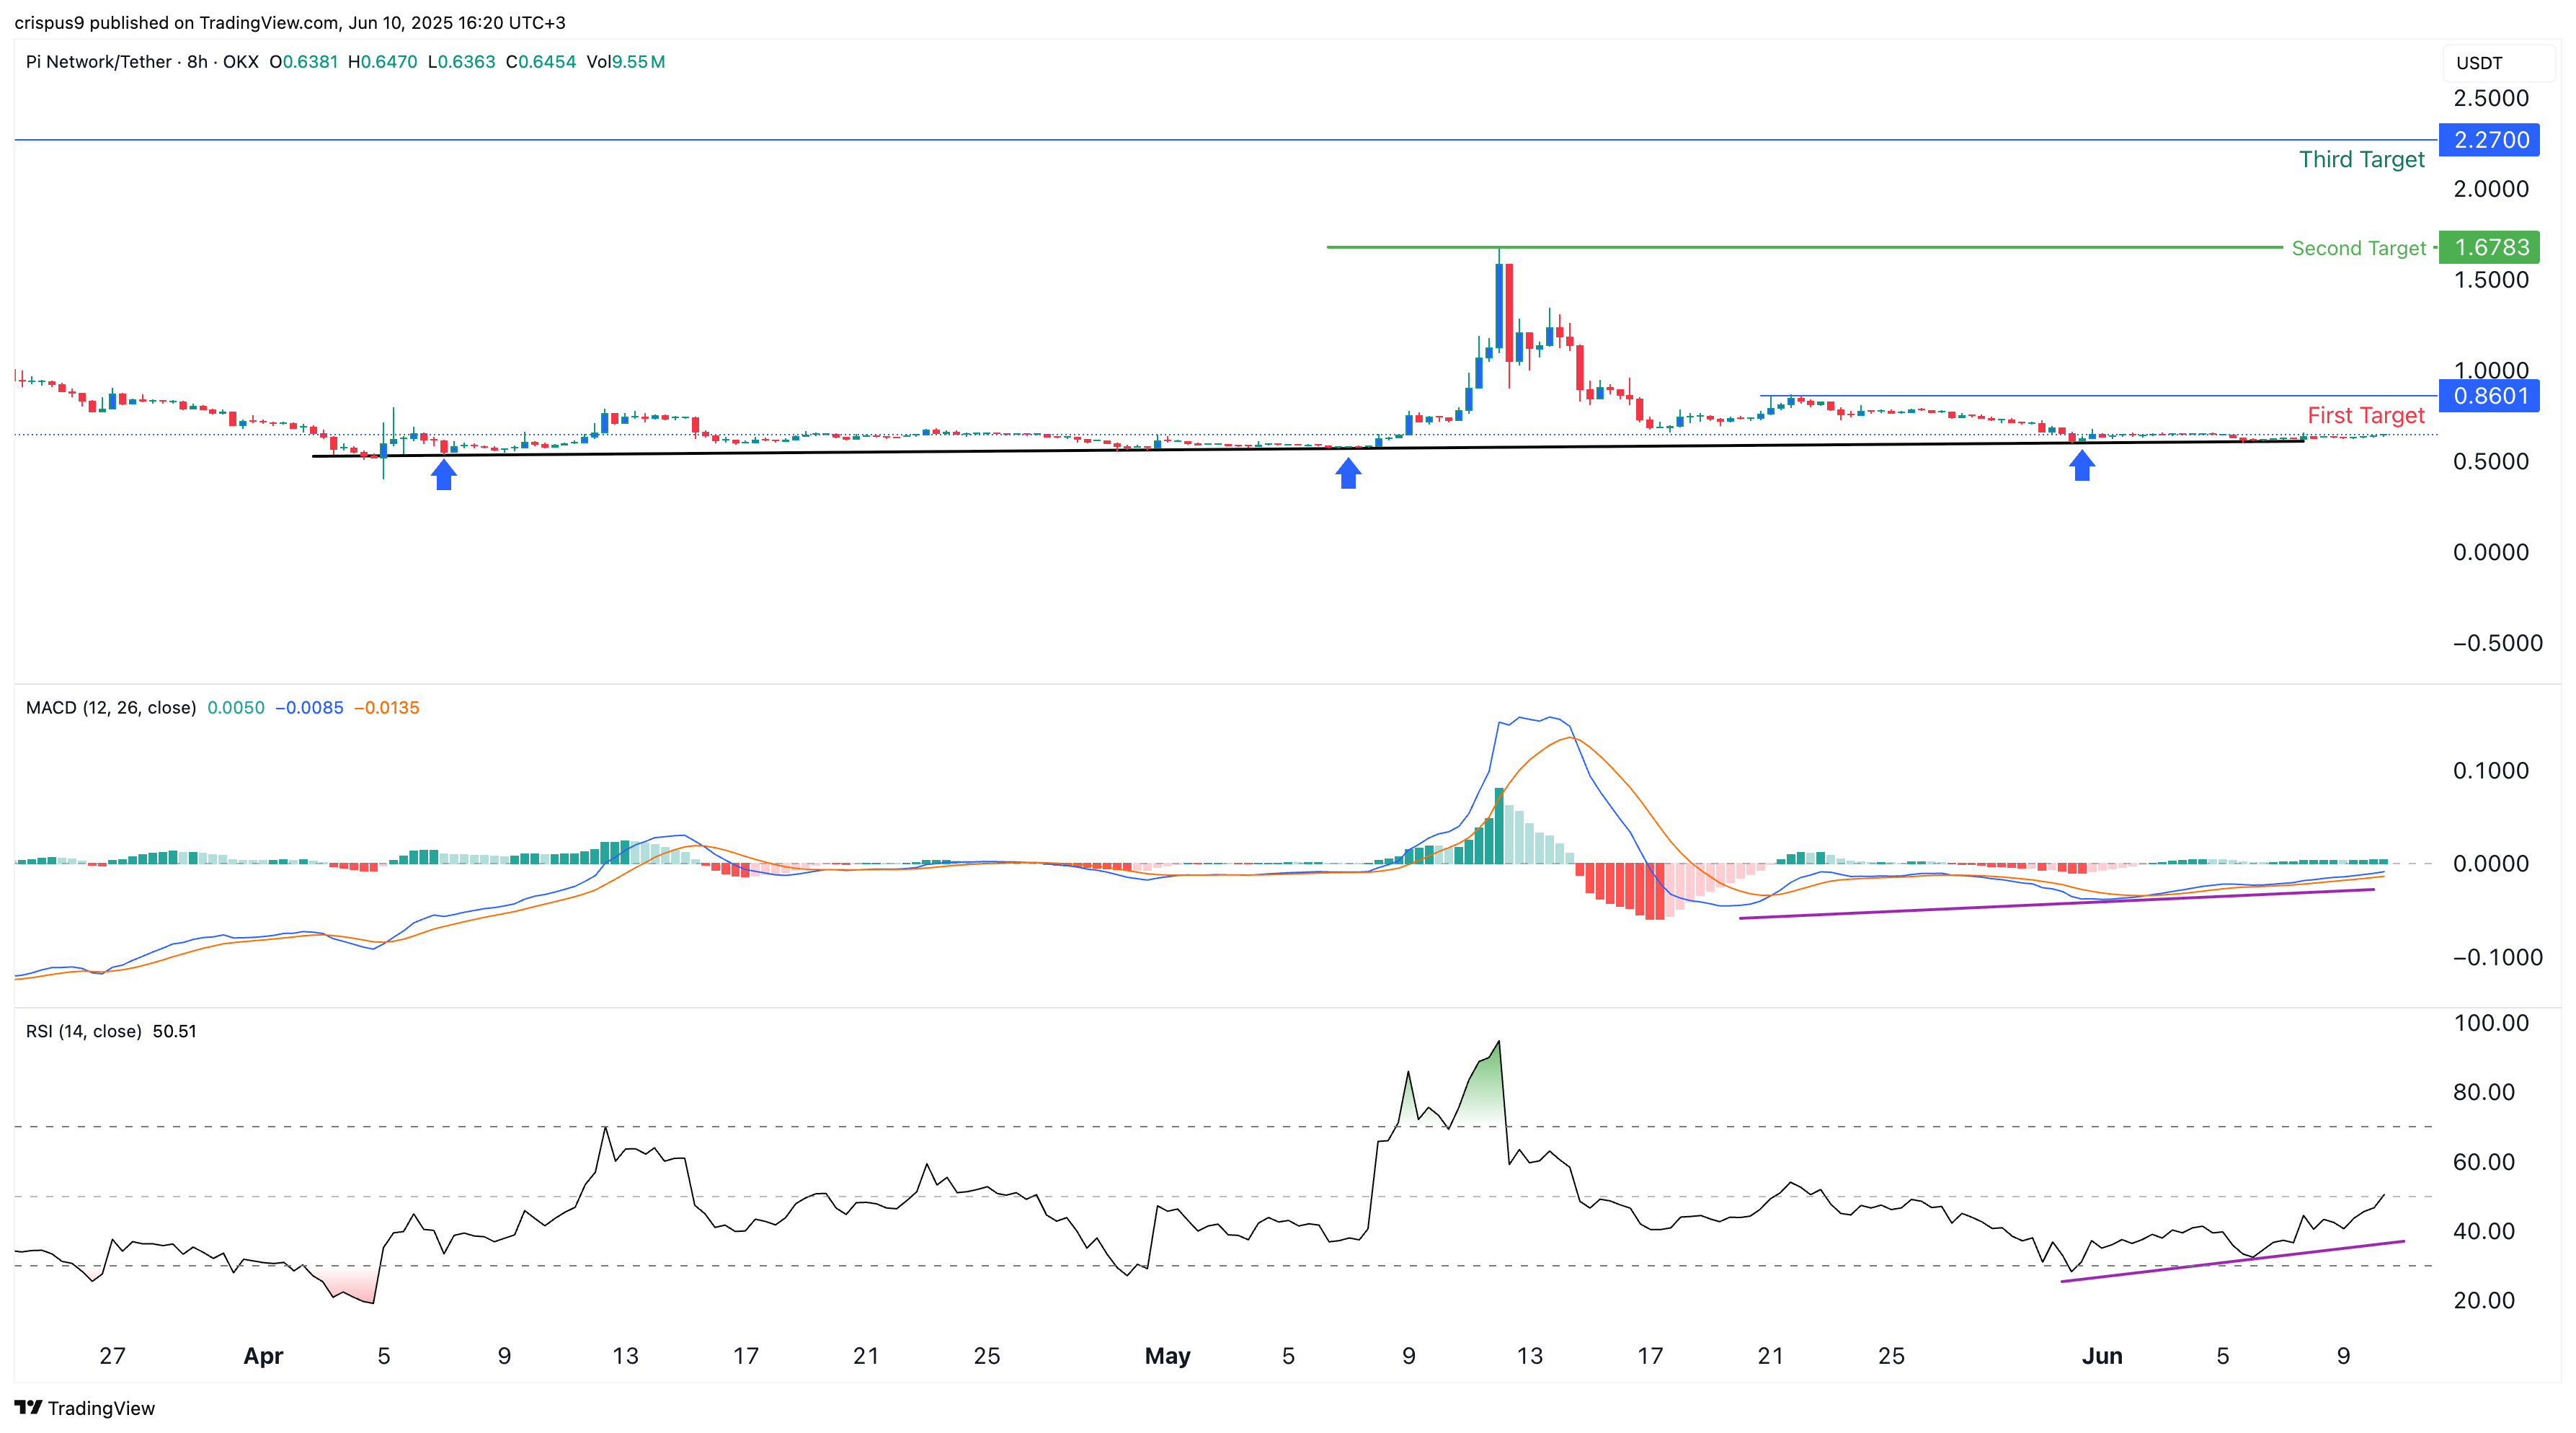
The bullish Pi Coin price forecast will become invalid if the price drops below the lower side of the triple-bottom pattern at $0.60. Losing that support will signal a 30% downside for Pi Network token to revisit the all-time low of $0.40.
For a long term price prediction around Pi Network price between 2025 and 2030 – Read this
Frequently Asked Questions (FAQs)
1. Why will the Pi Network price rebound?
2. Why has the Pi coin price stalled?
3. What is the other bullish case for Pi Network coin?

Why Trust CoinGape
CoinGape has covered the cryptocurrency industry since 2017, aiming to provide informative insights Read more…to our readers. Our journal analysts bring years of experience in market analysis and blockchain technology to ensure factual accuracy and balanced reporting. By following our Editorial Policy, our writers verify every source, fact-check each story, rely on reputable sources, and attribute quotes and media correctly. We also follow a rigorous Review Methodology when evaluating exchanges and tools. From emerging blockchain projects and coin launches to industry events and technical developments, we cover all facets of the digital asset space with unwavering commitment to timely, relevant information.

Related Articles


- Jane Street and Abu Dhabi Wealth Fund Mubadala Increase Holdings In BlackRock’s Bitcoin ETF
- FOMC Minutes Drop Tomorrow: Will Crypto Market Rally or Face Fed Shock?
- BlackRock Amends Filing For Staked Ethereum ETF, Eyes 18% of Staking Rewards From ETH Fund
- Arizona Advances Bitcoin, XRP Reserve Bill Using Seized Crypto Assets
- Bitcoin ETF Update: BlackRock Signals BTC Sell-Off as Kevin O’Leary Warns of Decline In Institutional Demand
- Pi Network Price Beats Bitcoin, Ethereum, XRP as Upgrades and Potential CEX Listing Fuels Demand
- 5 Things Dogecoin Price Needs to Hit $0.20 in Feb 2026
- Bitcoin Price Prediction as Experts Warns of Quantum Risks
- Dogecoin, Shiba Inu, Pepe Coin Price Predictions As BTC Crashes Below $68k
- Ethereum Price Outlook as Harvard Shifts Focus from Bitcoin to ETH ETF
- HOOD and COIN Stock Price Forecast as Expert Predicts Bitcoin Price Crash to $10k


